Virtus Investment Partners Reschedules Third Quarter 2026 Financial Results to Monday, November 9

Virtus Investment Partners Reschedules Third Quarter 2026 Financial Results to Monday, November 9

Conference Call at 10:00 a.m. Eastern

HARTFORD, Conn.–(BUSINESS WIRE)–
Virtus Investment Partners, Inc. (NYSE: VRTS), which operates a multi-boutique asset management business, today announced that it has rescheduled the release of its financial results for the third quarter of 2026 to allow additional time to complete its quarter-end financial reporting process. The company will now release its results before the market opens on Monday, November 9, 2026. George R. Aylward, president and chief executive officer, and Michael A. Angerthal, executive vice president and chief financial officer, will host a conference call and webcast with the investment community at 10:00 a.m. Eastern.

The presentation that will accompany the conference call will be available in the Presentations section of virtus.com. A replay of the call will be available in the Investor Relations section for at least one year.

About Virtus Investment Partners, Inc.

Virtus Investment Partners (NYSE: VRTS) is a distinctive partnership of boutique investment managers singularly committed to the long-term success of individual and institutional investors. We provide investment products and services from our investment managers, each with a distinct investment style and autonomous investment process, as well as select subadvisers. Investment solutions are available across multiple disciplines and product types to meet a wide array of investor needs. Additional information about our firm, investment partners, and strategies is available at virtus.com.

Investor Relations Contact:

Sean Rourke

(860) 263-4709

[email protected]

Media Relations Contact:

Laura Parsons

(860) 503-1382

[email protected]

KEYWORDS: Connecticut United States North America

INDUSTRY KEYWORDS: Other Professional Services Asset Management Professional Services Finance

MEDIA:

Logo
Logo

Virgin Galactic’s Spaceship Apeiron Arrives Home to Spaceport America

Virgin Galactic’s Spaceship Apeiron Arrives Home to Spaceport America

  • Lead Next-Generation Spaceship Was Flown from Virgin Galactic’s Spaceship Factory in Arizona to Its Operations Base in New Mexico

  • Spaceship Apeiron Will Undergo Flight Tests before Commercial Spaceflights Are Expected to Begin in Early Q2 2027

  • Second Spaceship Will Continue Through Production, with Commercial Spaceflights Expected to Begin in Late Q2/Early Q3 2027

TRUTH OR CONSEQUENCES, N.M.–(BUSINESS WIRE)–
Virgin Galactic (NYSE: SPCE), the world’s first commercial spaceline, today flew Apeiron, the lead Spaceship in its next-generation fleet, to Spaceport America in New Mexico, its permanent home and base of operations.

Earlier today, the Spaceship was named and revealed in its completed livery for the first time at Virgin Galactic’s Spaceship Factory in Mesa, Arizona. Spaceship Apeiron then departed Phoenix-Mesa Gateway Airport at 10:29 a.m. MST, mated to Eve, the company’s launch vehicle, and landed at Spaceport America at 12:59 p.m. MDT. Pilot in Command Michael Masucci and Pilot Dan Alix flew Eve, with Flight Test Engineer Tori Crichton on board.

Apeiron, ancient Greek for “boundless,” was chosen by public vote from a shortlist developed by Virgin Galactic teammates and members of its astronaut community, with people from more than 80 countries taking part.

“This morning, we gave Apeiron a name. This afternoon, Apeiron came home,” said Michael Colglazier, Chief Executive Officer of Virgin Galactic. “Seeing the ship fly beneath Eve to Spaceport America was a moment years in the making. To our team and our astronaut community: your Spaceship has arrived.”

With Apeiron now at Spaceport America, Virgin Galactic’s engineering team plans to complete avionics software integration and validation while conducting flight test preparations. Upon successful completion of the flight test program, Virgin Galactic plans to begin flying customers aboard Spaceship Apeiron, with commercial spaceflights expected to begin in early Q2 2027.

Apeiron is Virgin Galactic’s lead next-generation Spaceship, produced in partnership with major aerospace suppliers. Designed to fly twice per week with a vehicle lifetime of more than 500 missions, each Spaceship in the next-generation fleet is built to support the economics of a scaled commercial operation, with increased flight cadence and a cost profile unprecedented in the industry.

Production of the fleet is already moving forward. At the Spaceship Factory, assembly of the static test article and the second Spaceship is underway, and teams are preparing the rocket motor assembly line. The second Spaceship is expected to begin commercial operations in late Q2/early Q3 2027.

About Virgin Galactic

Virgin Galactic is dedicated to expanding the boundaries of human possibility. Through its spaceflight expeditions, the company offers people a profound new perspective on our planet and their own potential, while enabling scientific discovery and supporting strategic government missions. Virgin Galactic combines world-class aerospace engineering with thoughtfully designed astronaut experiences and a scalable spaceline operating model. Its reusable, air-launched Spaceships are designed to make spaceflight safe, repeatable, operationally efficient, and increasingly accessible, advancing a long-term vision of opening space to millions for extraordinary purposes. Learn more at www.virgingalactic.com.

Forward-Looking Statements

This press release contains forward-looking statements within the meaning of the Private Securities Litigation Reform Act of 1995. Virgin Galactic intends such forward-looking statements to be covered by the safe harbor provisions for forward-looking statements contained in Section 27A of the Securities Act of 1933, as amended (the “Securities Act”) and Section 21E of the Securities Exchange Act of 1934, as amended (the “Exchange Act”). All statements contained in this press release other than statements of historical fact, including, without limitation, statements regarding Virgin Galactic’s spaceflight systems, development of Virgin Galactic’s lead and second next-generation Spaceships and planned timeline for flight tests and commercial service using such Spaceships, including plans to commence commercial service with the lead spaceship in early Q2 2027 and with the second Spaceship in late Q2 or early Q3 2027, the timeline and process to complete avionics software integration and validation, the timeline and process to complete the flight test program, including glide flights and rocket-powered flights, the ability for next-generation Spaceships to fly twice per week with a vehicle lifetime of more than 500 missions, next-generation fleet supporting the economics of a scaled commercial operation with increased flight cadence and a cost profile unprecedented in the industry, and ongoing preparation of the rocket motor assembly line are forward-looking statements. The words “believe,” “may,” “will,” “estimate,” “potential,” “continue,” “anticipate,” “intend,” “expect,” “strategy,” “future,” “could,” “would,” “project,” “plan,” “target,” and similar expressions are intended to identify forward-looking statements, though not all forward-looking statements use these words or expressions. These statements are neither promises nor guarantees, but involve known and unknown risks, uncertainties and other important factors that may cause Virgin Galactic’s actual results, performance or achievements to be materially different from any future results, performance or achievements expressed or implied by the forward-looking statements, including but not limited to any delay in future commercial flights of its spaceflight fleet, Virgin Galactic’s ability to successfully develop and test its next generation vehicles, and the time and costs associated with doing so, its expected capital requirements and the availability of additional financing, and the other factors, risks and uncertainties included in Virgin Galactic’s Annual Report on Form 10-K for the fiscal year ended December 31, 2025, as such factors may be updated from time to time in its other filings with the Securities and Exchange Commission (the “SEC”), accessible on the SEC’s website at www.sec.gov and the Investor Relations section of Virgin Galactic’s website at www.virgingalactic.com, which could cause its actual results to differ materially from those indicated by the forward-looking statements made in this press release. Any such forward-looking statements represent management’s estimates as of the date of this press release. While Virgin Galactic may elect to update such forward-looking statements at some point in the future, it disclaims any obligation to do so, even if subsequent events cause its views to change.

Media Contact:

Aleanna Crane – Vice President, Communications

[email protected]

KEYWORDS: Arizona New Mexico United States North America

INDUSTRY KEYWORDS: Software Electronic Design Automation Engineering Technology Air Aerospace Transport Manufacturing

MEDIA:

Evolution Metals & Technologies Submits Response to U.S. Army Sources Sought Notice for Rare Earth Magnets Used in Small Drone Motors

EM&T commercially produces N42SH, one of the two magnet grades specified by the Army for small drone motors

EM&T’s leadership includes President Andrew Knaggs, former Deputy Assistant Secretary of Defense; Gen. Tom Bussiere (ret.), former Commander of Air Force Global Strike Command; and the Hon. Chris Miller, former Acting U.S. Secretary of Defense, providing the Company with extensive defense procurement and supply chain experience

Miami, FL, Oct. 28, 2026 (GLOBE NEWSWIRE) — Evolution Metals & Technologies Corp. (“EM&T” or the “Company”) (Nasdaq: EMAT), a U.S.-based critical materials and advanced manufacturing company, today announced that it has submitted a capability statement in response to the U.S. Army’s Sources Sought notice for rare earth magnets used in the brushless DC motors of small uncrewed aircraft systems.

The U.S. Army Contracting Command (ACC) issued the Sources Sought notice, a Request for Information (RFI), “as part of its market research to identify companies with the interest and capability to manufacture and supply commercial-grade rare earth magnets.” The RFI lists neodymium-iron-boron arc-segment magnets in grade N52SH or N42SH. EM&T can produce eight sintered neodymium-iron-boron magnet grades: N35SH, N42SH, N46SH, N48SH, N42H, N45H, N48M and N50M. EM&T commercially produces N42SH at its facility in Pohang, Republic of Korea, where the grade has completed customer qualification, and plans to expand annual magnet capacity there from approximately 1,000 metric tons to approximately 10,000 metric tons following the installation and commissioning of the 57 containers of ULVAC production equipment.

In its response, EM&T proposed a staged path to qualify magnets to the Army’s specifications and an auditable mine-to-magnet traceability record for each production lot, in line with DFARS 252.225-7052 sourcing requirements that expand on January 1, 2027.

“Drones have become one of the most important tools on the modern battlefield, and every one of their motors depends on high-performance rare earth magnets that today come overwhelmingly from China,” said Andrew Knaggs, President of EM&T. “We already make N42SH commercially, we know how to qualify grades for demanding customers, and we are scaling to approximately 10,000 metric tons in Pohang. We are prepared to work with the Army on qualification and to establish a secure, traceable domestic supply chain for drone magnets. We are certified and going into commercial production of seven additional grades representing 52% of the total sintered market globally by revenue.”

“Air power, from strategic bombers to small drones, runs on components most people never see, and rare earth magnets are one of the most critical,” said retired Gen. Tom Bussiere, a member of EM&T’s Board of Directors and former Commander of Air Force Global Strike Command. “A force that cannot secure its magnet supply cannot be sure of its readiness. EM&T is building the allied, traceable production capacity our warfighters need.”

“Our reliance on China for rare earth magnets is a national security vulnerability, and it will not be solved by policy alone. It takes manufacturers with real plants, real equipment and real customers,” said the Hon. Chris Miller, a member of EM&T’s Board of Directors and former Acting U.S. Secretary of Defense. “EM&T is producing magnets today with a close U.S. ally and is significantly expanding our production scale outside of China. That is exactly the industrial base the United States needs to rebuild.”

About Evolution Metals & Technologies Corp.

Evolution Metals & Technologies Corp. (Nasdaq: EMAT) is a U.S.-based critical materials and advanced manufacturing company for rare earth permanent magnets, battery materials, and related critical minerals and technologies. By leveraging proven commercial-scale operations, advanced processing technologies, and strategic partnerships, EM&T operates what it believes is one of the only vertically integrated critical materials supply chain spanning end-of-life electronics and batteries, high-grade concentrates, and the manufacture of finished rare earth magnets (including high-performance rare earth magnets) and battery materials. For additional information, please visit investors.evolution-metals.com and follow the Company on LinkedIn.

Cautionary Note Regarding Forward-Looking Statements

This press release may contain forward-looking statements within the meaning of Section 27A of the Securities Act of 1933, as amended, Section 21E of the Securities Exchange Act of 1934, as amended, and the United States Private Securities Litigation Reform Act of 1995. Forward-looking statements include, but are not limited to, statements regarding the Company’s response to the U.S. Army Sources Sought notice and any future solicitation, qualification, contract or order that may result; the Company’s ability to qualify and supply magnets meeting the Army’s specifications, including grade, geometry, coating and source-origin requirements; the installation, commissioning and operation of ULVAC equipment at the Company’s Pohang facility; the planned expansion of annual rare earth magnet production capacity to approximately 10,000 metric tons, including approximately 6,000 metric tons of high-performance sintered magnets; the January 1, 2027 effective date and scope of DFARS 252.225-7052; and the Company’s strategy, business plans and growth opportunities. These forward-looking statements, together with terms such as anticipate, believe, expect, intend, may, plan, should, will and other comparable terms, involve risks and uncertainties because they relate to events and depend on circumstances that will occur in the future. Such risks include, among others, that the Army may not issue a solicitation or award a contract to the Company; the outcome of any Government-specific qualification, first-article testing or source-origin review; delays in equipment installation or commissioning; the availability and cost of feedstock; customer qualification and demand; the availability of financing and working capital; changes in U.S. or Korean trade, tariff, industrial or defense procurement policy, including the DFARS 252.225-7052 effective date, scope or waiver practices; competition; and the other risks described in EM&T’s filings with the U.S. Securities and Exchange Commission. Forward-looking statements are not guarantees of future performance, and actual results may differ materially from those expressed or implied. Readers are cautioned not to place undue reliance on these statements, which speak only as of the date made. EM&T undertakes no obligation to update any forward-looking statement except as required by law. Additional information concerning factors that may affect EM&T’s expectations and projections is contained in its Annual Report on Form 10-K for the year ended December 31, 2025, filed with the SEC on February 20, 2026, its Quarterly Report on Form 10-Q for the three and six months ended June 30, 2026, filed with the SEC on August 17, 2026, including the disclosures under “Risk Factors” therein, and other documents filed or to be filed with the SEC by EM&T. SEC filings are available at www.sec.gov.

Contacts

Arx Investor Relations

North American Equities Desk
[email protected]

PR, Marketing & Global Partnerships
Phoenix MGMT & Consulting
[email protected]
888-228-0122


B&G Foods Declares Regular Quarterly Dividend

B&G Foods Declares Regular Quarterly Dividend

PARSIPPANY, N.J.–(BUSINESS WIRE)–
B&G Foods, Inc. (NYSE: BGS) announced today that its Board of Directors has declared a regular quarterly cash dividend of $0.095 per share of common stock. The dividend is payable on January 26, 2027 to stockholders of record as of December 31, 2026.

At the closing market price of the common stock on October 28, 2026, the current dividend rate represents an annualized yield of 18.4%. This is the 89th consecutive quarterly dividend declared by the Board of Directors since B&G Foods’ initial public offering in October 2004.

About B&G Foods, Inc.

Based in Parsippany, New Jersey, B&G Foods and its subsidiaries manufacture, sell and distribute high-quality, branded shelf-stable and frozen foods across the United States, Canada and Puerto Rico. With B&G Foods’ diverse portfolio of more than 45 brands you know and love, including B&G, Bear Creek, College Inn, Cream of Wheat, Crisco, Dash, Kitchen Basics, Las Palmas, Mama Mary’s, Maple Grove Farms, New York Style, Ortega, Polaner, Spice Islands and Victoria, there’s a little something for everyone. For more information about B&G Foods and its brands, please visit www.bgfoods.com.

Investor Relations:

ICR, Inc.

Anna Kate Heller

[email protected]

Media Relations:

ICR, Inc.

Matt Lindberg

[email protected]

KEYWORDS: New Jersey United States North America

INDUSTRY KEYWORDS: Retail Supermarket Food/Beverage

MEDIA:

Silicon Motion Announces Results for the Quarterly Period Ended September 30, 2026


Business Highlights

  • Third quarter of 2026 sales increased 24% Q/Q and increased 131% Y/Y
    • SSD controller sales: 3Q of 2026 increased 20% to 25% Q/Q and increased 55% to 60% Y/Y
    • eMMC+UFS controller sales: 3Q of 2026 decreased 10% to 15% Q/Q and increased 35% to 40% Y/Y
    • Ferri & Boot Drive solutions sales: 3Q of 2026 increased 75% to 80% Q/Q and increased 2,580% to 2,585% Y/Y 


Financial Highlights

 
3


Q 202


6


GAAP

3


Q 202


6


Non-GAAP*
•  Net sales $560.2 million
(+24% Q/Q, +131% Y/Y)
$560.2 million
(+24% Q/Q, +131% Y/Y)
•  Gross margin 53.6% 53.7%
•  Operating margin 29.0% 32.1%
•  Earnings per diluted ADS $1.91  $4.35

* Please see reconciliations of U.S. Generally Accepted Accounting Principles (“GAAP”) to all non-GAAP financial measures mentioned herein towards the end of this news release.

TAIPEI, Taiwan and MILPITAS, Calif., Oct. 29, 2026 (GLOBE NEWSWIRE) — Silicon Motion Technology Corporation (NasdaqGS: SIMO) (“Silicon Motion,” the “Company,” “we” or similar terms) today announced its financial results for the quarter ended September 30, 2026.  For the third quarter of 2026, net sales (GAAP) increased sequentially to $560.2 million from $451.0 million in the second quarter of 2026. Net income (GAAP) decreased sequentially to $65.3 million, or $1.91 per diluted American depositary share (“ADS”) (GAAP), from net income (GAAP) of $136.1 million, or $3.99 per diluted ADS (GAAP), in the second quarter of 2026.

For the third quarter of 2026, net income (non-GAAP) increased sequentially to $149.2 million, or $4.35 per diluted ADS (non-GAAP), from net income (non-GAAP) of $83.1 million, or $2.43 per diluted ADS (non-GAAP), in the second quarter of 2026.

All financial numbers are in U.S. dollars unless otherwise noted.


Third Quarter of 2026 Review

“Silicon Motion is rapidly evolving from a consumer-focused NAND flash controller supplier into a diversified leader in controllers and storage solutions, serving markets from AI infrastructure to the edge,” said Wallace Kou, President and CEO of Silicon Motion. “In the third quarter, revenue, gross margin and operating margin all grew meaningfully. This was driven by our Ferri product family for automotive and edge AI and enterprise boot drive solutions, and by our SSD controller businesses, including edge and enterprise SSD controllers, with our new MonTitan enterprise and AI controllers beginning to scale. Building on the strong results we have delivered this year, we expect continued momentum in the fourth quarter as we broaden our product portfolio and expand into new markets, providing a foundation for sustainable, long-term growth in revenue and profitability.”

Key Financial Results

(in millions, except percentages and per ADS amounts) GAAP Non-GAAP
3Q 2026 2Q 2026 3Q 2025 3Q 2026 2Q 2026 3Q 2025
Revenue $560.2 $451.0 $242.0 $560.2 $451.0 $242.0
Gross profit $300.4 $226.2 $117.7 $300.7 $226.3 $117.8
Percent of revenue 53.6
%
50.2
%
48.6
%
53.7
%
50.2
%
48.7
%
Operating expenses $137.9 $125.1 $88.5 $120.7 $122.1 $79.5
Operating income $162.6 $101.1 $29.2 $180.0 $104.2 $38.3
Percent of revenue 29.0
%
22.4
%
12.1
%
32.1
%
23.1
%
15.8
%
Earnings per diluted ADS $1.91 $3.99 $1.16 $4.35 $2.43 $1.00
             

Other Financial Information

(in millions) 3Q 2026 2Q 2026 3Q 2025
Cash, cash equivalents and restricted cash—end of period $953.6 $181.8 $272.4
Routine capital expenditures $20.1 $5.8 $9.9
Dividend payments $16.9 $16.9 $16.7
Proceeds from (Repayment of) bank loans ($59.2) $59.2 –
Proceeds from convertible notes $1,125.9 – –
       

During the third quarter of 2026, we had $23.0 million of capital expenditures, including $20.1 million for the routine purchases of testing equipment, software, design tools and other items, and $2.9 million for building construction.


Returning Value to Shareholders

On October 27, 2025, our Board of Directors declared a $2.00 per ADS annual cash dividend to be paid in quarterly installments of $0.50 per ADS. On August 20, 2026, we paid $16.9 million to Silicon Motion shareholders as the fourth installment of the annual cash dividend. On October 16, 2026, our Board of Directors declared a $2.30 per ADS annual dividend, representing an annual increase of 15%, to be paid in quarterly installments of $0.575 per ADS. The first installment of our annual dividend will be paid on November 19, 2026 to all Silicon Motion shareholders of record as of the close of business on November 5, 2026.


Business Outlook

“The NAND industry is undergoing significant change. Growing demand for enterprise and AI storage is absorbing a larger share of industry supply and pushing NAND flash prices higher. In response, NAND manufacturers are increasingly prioritizing high-capacity enterprise SSDs and pulling back from certain consumer-oriented segments, including PCs, mobile devices, IoT, automotive and enterprise boot drives. We believe this shift creates a meaningful opportunity for our products in these segments. Our proprietary controller technology and nearly two decades of NAND ecosystem relationships, together with our investments in eMMC and UFS solutions, 6nm PCIe Gen 5 edge SSD controllers, 4nm PCIe Gen 6 MonTitan enterprise and AI SSD controllers, and our Ferri and boot drive product families, position us to address demand across AI data center, AI server, edge AI and physical AI applications.”

“While rising memory costs have created pricing pressure in some consumer device segments, our enterprise and Ferri customers have generally prioritized supply assurance over price. As our revenue mix continues to shift toward enterprise and AI applications, our backlog and customer forecasts support our expectation of continued growth. Based on results to date and current visibility, we believe we are on track to deliver record annual revenue in 2026, representing more than 100% growth over the prior year, with our enterprise and AI product families still in the early stages of revenue contribution,” said Mr. Kou.

For the fourth quarter of 2026, management expects:

($ in millions, except percentages) GAAP Non-GAAP Adjustment Non-GAAP
Revenue $588 to $616
+5% to 10% Q/Q
+111% to 121% Y/Y
— $588 to $616
+5% to 10% Q/Q
+111% to 121% Y/Y
Gross margin 53.8% to 54.8% Approximately $1.0* 54.0% to 55.0%
Operating margin 29.9% to 31.4% Approximately $34.6 to $35.6** 36.0% to 37.0%

* Projected gross margin (non-GAAP) excludes $1.0 million of stock-based compensation.
** Projected operating margin (non-GAAP) excludes $34.6 million to $35.6 million of stock-based compensation and dispute-related expenses.

Convertible Notes Offering
On August 13, 2026, the Company completed the issuance of $1,150,000,000 aggregate principal amount of 0.00% Convertible Senior Notes due 2031 (the “Convertible Notes”), including the exercise in full of the initial purchasers’ option to purchase an additional $150,000,000 aggregate principal amount. The Convertible Notes are senior, unsecured obligations of the Company, do not bear regular interest, and will mature on August 15, 2031, unless earlier repurchased, redeemed, or converted. The Company will settle conversions by paying the principal amount in cash, with any conversion value in excess of the principal amount settled in cash, ADSs, or a combination thereof, at the Company’s election. The Company may redeem the Convertible Notes on or after August 20, 2029 if the last reported sale price of the ADSs equals or exceeds 130% of the conversion price for a specified period. The Convertible Notes were issued in a private offering to persons reasonably believed to be “qualified institutional buyers” pursuant to Rule 144A under the Securities Act of 1933, as amended. The Company intends to use the net proceeds for general corporate purposes and the repayment of outstanding borrowings under our credit agreement with CTBC Bank Co., Ltd. The Convertible Notes are reflected as a long-term liability of approximately $1.1 billion on the Company’s consolidated balance sheet as of September 30, 2026.

Conference Call & Webcast:
The Company’s management team will host a conference call at 8:00 a.m. Eastern Time on October 29, 2026. 

Conference Call Details

Participants must register in advance to join the conference call using the link provided below. Conference access details, including dial-in information and a unique access PIN, will be provided in the confirmation email received upon registration.

Participant Online Registration:
https://register-conf.media-server.com/register/BI5a2f2137ff5446e59f001272500c5465

A webcast of the call will be available on the Company’s website at www.siliconmotion.com.

Discussion of Non-GAAP Financial Measures

To supplement the Company’s unaudited consolidated financial results calculated in accordance with GAAP, the Company discloses certain non-GAAP financial measures that exclude stock-based compensation and other items, including gross profit (non-GAAP), gross margin (non-GAAP), operating expenses (non-GAAP), operating profit (non-GAAP), operating margin (non-GAAP), non-operating income (expense) (non-GAAP), net income (non-GAAP), and earnings per diluted ADS (non-GAAP). These non-GAAP measures are not in accordance with or an alternative to GAAP and may be different from similarly titled non-GAAP measures used by other companies.  We believe that these non-GAAP measures have limitations in that they do not reflect all the amounts associated with the Company’s results of operations as determined in accordance with GAAP and that these measures should only be used to evaluate the Company’s results of operations in conjunction with the corresponding GAAP measures.  The presentation of this additional information is not meant to be considered in isolation or as a substitute for the most directly comparable GAAP measure.  We compensate for the limitations of our non-GAAP financial measures by relying upon GAAP results to gain a complete picture of our performance.

Our non-GAAP financial measures are provided to enhance the user’s overall understanding of our current financial performance and our prospects for the future. Specifically, we believe the non-GAAP results provide useful information to both management and investors as these non-GAAP results exclude certain expenses, gains and losses that we believe are not indicative of our core operating results and because they are consistent with the financial models and estimates published by many analysts who follow the Company.  We use non-GAAP measures to evaluate the operating performance of our business, for comparison with our forecasts, and for benchmarking our performance externally against our competitors.  Also, when evaluating potential acquisitions, we exclude the items described below from our consideration of the target’s performance and valuation.  Since we find these measures to be useful, we believe that our investors benefit from seeing the results from management’s perspective in addition to seeing our GAAP results.  We believe that these non-GAAP measures, when read in conjunction with the Company’s GAAP financials, provide useful information to investors by offering:

  • the ability to make more meaningful period-to-period comparisons of the Company’s on-going operating results;
  • the ability to better identify trends in the Company’s underlying business and perform related trend analysis;
  • a better understanding of how management plans and measures the Company’s underlying business; and
  • an easier way to compare the Company’s operating results against analyst financial models and operating results of our competitors that supplement their GAAP results with non-GAAP financial measures.

The following are explanations of each of the adjustments that we incorporate into our non-GAAP measures, as well as the reasons for excluding each of these individual items in our reconciliation of these non-GAAP financial measures:

Stock-based compensation expense consists of non-cash charges related to the fair value of restricted stock units awarded to employees. The Company believes that the exclusion of these non-cash charges provides for more accurate comparisons of our operating results to our peer companies due to the varying available valuation methodologies, subjective assumptions and the variety of award types. In addition, the Company believes it is useful to investors to understand the specific impact of share-based compensation on its operating results.

Dispute
related expenses consist of legal, consulting, and other fees and resolution costs related to the dispute.

Foreign exchange loss (gain) consists of remeasurement gains and/or losses of non-US$ denominated current assets and current liabilities, as well as certain other balance sheet items, which result from the appreciation or depreciation of non-US$ currencies against the US$. We do not use financial instruments to manage the impact on our operations from changes in foreign exchange rates, and because our operations are subject to fluctuations in foreign exchange rates, we therefore exclude foreign exchange gains and losses when presenting non-GAAP financial measures.

Realized/Unrealized loss (gain) on investments relates to the disposal and net change in fair value of long-term investments.

 
Silicon Motion Technology Corporation
Consolidated Statements of Income
(in thousands, except percentages and per ADS data, unaudited)
         
    For Three Months Ended   For Nine Months Ended
    Sep. 30,   Jun. 30,   Sep. 30,   Sep. 30,   Sep. 30,
    2025
  2026
  2026
  2025
  2026
     ($)    ($)    ($)    ($)    ($)
Net sales   241,999     451,001     560,216     607,166     1,353,323  
Cost of sales   124,311     224,784     259,797     316,424     665,426  
Gross profit   117,688     226,217     300,419     290,742     687,897  
Operating expenses                    
Research & development   69,461     104,654     115,812     182,634     306,706  
Sales & marketing   9,492     13,064     13,235     23,701     39,588  
General & administrative   9,503     7,385     8,821     23,081     25,734  
Operating income   29,232     101,114     162,551     61,326     315,869  
Non-operating income (expense)                    
Interest income, net   2,160     1,390     2,919     7,796     5,926  
Foreign exchange gain (loss), net   574     (381)     (63)     (2,355)     (428)  
Realized/Unrealized gain (loss) on investments, net   13,002     74,727     (77,972)     15,246     18,514  
Others, net   –     –     –     1     –  
Subtotal   15,736     75,736     (75,116)     20,688     24,012  
Income before income tax   44,968     176,850     87,435     82,014     339,881  
Income tax expense   5,856     40,738     22,127     7,128     71,661  
Net income   39,112     136,112     65,308     74,886     268,220  
                     
Earnings per basic ADS   1.17     4.01     1.93     2.23     7.93  
Earnings per diluted ADS   1.16     3.99     1.91     2.23     7.88  
                     
Margin Analysis:                    
Gross margin   48.6%     50.2%     53.6%     47.9%     50.8%  
Operating margin   12.1%     22.4%     29.0%     10.1%     23.3%  
Net margin   16.2%     30.2%     11.7%     12.3%     19.8%  
                     
Additional Data:                    
Weighted avg. ADS equivalents   33,560     33,908     33,908     33,584     33,831  
Diluted ADS equivalents   33,592     34,097     34,135     33,651     34,049  


Silicon Motion Technology Corporation
Reconciliation of GAAP to Non-GAAP Operating Results
(in thousands, except percentages and per ADS data, unaudited)
       
  For Three Months Ended   For Nine Months Ended
  Sep. 30,   Jun. 30,   Sep. 30,   Sep. 30,   Sep. 30,
2025
  2026
  2026
  2025
  2026
 ($)    ($)    ($)    ($)    ($)
Gross profit (GAAP) 117,688     226,217     300,419     290,742     687,897  

Gross margin (GAAP)
48.6%     50.2%     53.6%     47.9%     50.8%  
Stock-based compensation (A) 86     74     267     160     475  
Gross profit (non-GAAP)  117,774     226,291     300,686     290,902     688,372  

Gross margin (non-GAAP)
48.7%     50.2%     53.7%     47.9%     50.9%  
                   
Operating expenses (GAAP) 88,456     125,103     137,868     229,416     372,028  
Stock-based compensation (A) (5,435)     (3,344)     (17,080)     (10,346)     (28,664)  
Dispute related expenses (3,556)     320     (82)     (6,675)     (1,366)  
Operating expenses (non-GAAP) 79,465     122,079     120,706     212,395     341,998  
                   
Operating profit (GAAP) 29,232     101,114     162,551     61,326     315,869  

Operating margin (GAAP)
12.1%     22.4%     29.0%     10.1%     23.3%  
Total adjustments to operating profit 9,077     3,098     17,429     17,181     30,505  
Operating profit (non-GAAP) 38,309     104,212     179,980     78,507     346,374  

Operating margin (non-GAAP)
15.8%     23.1%     32.1%     12.9%     25.6%  
                   
Non-operating income (expense) (GAAP) 15,736     75,736     (75,116)     20,688     24,012  
Foreign exchange loss (gain), net (574)     381     63     2,355     428  
Realized/Unrealized gain (loss) on investments, net (13,002)     (74,727)     77,972     (15,246)     (18,514)  
                   
Non-operating income (expense) (non-GAAP) 2,160     1,390     2,919     7,797     5,926  
                   
Net income (GAAP) 39,112     136,112     65,308     74,886     268,220  
Total pre-tax impact of non-GAAP adjustments (4,499)     (71,248)     95,464     4,290     12,419  
Income tax impact of non-GAAP adjustments (789)     18,281     (11,614)     (2,070)     5,513  
Net income (non-GAAP) 33,824     83,145     149,158     77,106     286,152  
                   
Earnings per diluted ADS (GAAP) $1.16     $3.99     $1.91     $2.23     $7.88  
Earnings per diluted ADS (non-GAAP) $1.00     $2.43     $4.35     $2.29     $8.36  
                   
Shares used in computing earnings per diluted ADS (GAAP) 33,592     34,097     34,135     33,651     34,049  
Non-GAAP adjustments 110     154     191     59     189  
Shares used in computing earnings per diluted ADS (non-GAAP) 33,702     34,251     34,326     33,710     34,238  
                   
(A) Excludes stock-based compensation as follows:                  
Cost of sales 86     74     267     160     475  
Research & development 3,820     1,630     12,317     6,877     18,735  
Sales & marketing 677     863     1,808     1,618     4,678  
General & administrative 938     851     2,955     1,851     5,251  


Silicon Motion Technology Corporation
Consolidated Balance Sheets
(In thousands, unaudited)
             
    Sep. 30,


  Jun. 30,


  Sep. 30,


    2025


  2026


  2026


     ($)


   ($)


   ($)


Cash and cash equivalents   198,581     74,367     845,926  
Accounts receivable, net   201,576     323,638     443,470  
Inventories   337,967     673,042     870,916  
Restricted assets – current   70,227     103,918     103,918  
Prepaid expenses and other current assets   57,043     41,526     169,399  
Total current assets   865,393     1,216,491     2,433,629  
Long-term investments   32,705     127,403     49,490  
Property and equipment, net   211,080     232,805     236,321  
Other assets   27,846     28,532     34,904  
Total assets   1,137,025     1,605,231     2,754,344  
                   
Accounts payable   74,981     103,338     63,455  
Loans   –     59,183     –  
Income tax payable   19,231     37,969     71,123  
Accrued expenses and other current liabilities   157,504     281,716     293,675  
Total current liabilities   251,716     482,206     428,253  
Convertible notes   –     –     1,126,514  
Other long-term liabilities   51,506     76,177     68,820  
Total liabilities   303,222     558,383     1,623,587  
Shareholders’ equity   833,803     1,046,848     1,130,757  
Total liabilities & shareholders’ equity   1,137,025     1,605,231     2,754,344  


Silicon Motion Technology Corporation
Condensed Consolidated Statements of Cash Flows
(in thousands, unaudited)
       
  For Three Months Ended   For Nine Months Ended
  Sep. 30,   Jun. 30,   Sep. 30,   Sep. 30,   Sep. 30,
  2025
  2026
  2026
  2025
  2026
   ($)    ($)    ($)    ($)    ($)
Net income 39,112     136,112     65,308     74,886     268,220  
Depreciation & amortization 8,039     9,273     9,578     22,709     27,806  
Stock-based compensation 5,521     3,418     17,348     10,506     29,140  
Amortization of convertible notes issuance cost –     –     597     –     597  
Investment loss (gain) & disposals (12,886)     (74,684)     78,026     (15,142)     (18,391)  
Changes in operating assets and liabilities (12,905)     (137,899)     (426,967)     (33,080)     (658,486)  
Net cash provided by (used in) operating activities 26,881     (63,780)     (256,110)     59,879     (351,114)  
                   
Purchase of property & equipment (20,113)     (7,733)     (22,957)     (47,325)     (48,911)  
Purchase of long-term investments –     –     (4,000)     –     (4,000)  
Proceeds from long-term investments –     –     4,965     –     4,965  
Proceeds from disposal properties –     –     –     –     87  
Others 73     –     –     86     –  
Net cash provided by (used in) investing activities (20,040)     (7,733)     (21,992)     (47,239)     (47,859)  
                   
Proceeds from convertible notes –     –     1,125,917     –     1,125,917  
Dividend payments (16,749)     (16,922)     (16,922)     (50,451)     (50,762)  
Share repurchases –     –     –     (24,312)     –  
Proceeds from (Repayment of) bank loans –     59,183     (59,183)     –     –  
Net cash provided by (used in) financing activities (16,749)     42,261     1,049,812     (74,763)     1,075,155  
                   
Net increase (decrease) in cash, cash equivalents & restricted cash (9,908)     (29,252)     771,710     (62,123)     676,182  
Effect of foreign exchange changes 17     170     76     178     325  
Cash, cash equivalents & restricted cash—beginning of period 282,279     210,884     181,802     334,333     277,081  
Cash, cash equivalents & restricted cash—end of period 272,388     181,802     953,588     272,388     953,588  
                             

About Silicon Motion:
We are the global leader in supplying NAND flash controllers for solid state storage devices.  We supply more SSD controllers than any other company in the world for servers, PCs and other client devices and are the leading merchant supplier of eMMC and UFS embedded storage controllers used in smartphones, IoT devices and other applications.  We also supply customized high-performance hyperscale data centers and specialized industrial and automotive SSD solutions.  Our customers include most of the NAND flash vendors, storage device module makers and leading OEMs.  For further information on Silicon Motion, visit us at www.siliconmotion.com.

Forward-Looking Statements:

This news release contains “forward-looking statements” within the meaning of Section 27A of the Securities Act of 1933, as amended, and Section 21E of the Securities Exchange Act of 1934, as amended. In some cases, you can identify forward-looking statements by terminology such as “may,” “will,” “should,” “expect,” “intend,” “plan,” “anticipate,” “believe,” “estimate,” “predict,” “potential,” “continue,” or the negative of these terms or other comparable terminology. Although such statements are based on our own information and information from other sources we believe to be reliable, you should not place undue reliance on them. These statements involve risks and uncertainties, and actual market trends or our actual results of operations, financial condition or business prospects may differ materially from those expressed or implied in these forward-looking statements for a variety of reasons. Potential risks and uncertainties include, but are not limited to, the unpredictable volume and timing of customer orders, which are not fixed by contract but vary on a purchase order basis; the loss of one or more key customers or the significant reduction, postponement, rescheduling or cancellation of orders from one or more customers; general economic conditions or conditions in the semiconductor or consumer electronics markets; the impact of inflation on our business and customers’ businesses and any effect this has on economic activity in the markets in which we operate; the functionalities and performance of our information technology (“IT”) systems, which are subject to cybersecurity threats and which support our critical operational activities, and any breaches of our IT systems or those of our customers, suppliers, partners and providers of third-party licensed technology; the effects on our business and our customers’ business taking into account the ongoing U.S.-China tariffs and trade disputes; other factors beyond our control such as natural disasters, terrorism, civil unrest, war, including conflicts in the Middle East, threats to the Strait of Hormuz and global energy supply routes, and the ongoing Russia-Ukraine War, and pandemics, epidemics and other health emergencies; the continuing tensions between Taiwan and China, including enhanced military activities; decreases in the overall average selling prices of our products; changes in the relative sales mix of our products; supply chain disruptions that have affected us and our industry as well as other industries on a global basis; the payment, or non-payment, of cash dividends in the future at the discretion of our Board of Directors and any announced planned increases in such dividends; changes in our cost of finished goods; the availability, pricing, and timeliness of delivery of other components and raw materials used in the products we sell given the current raw material supply shortages being experienced in our industry; our customers’ sales outlook, purchasing patterns, and inventory adjustments based on consumer demands and general economic conditions; any potential impairment charges that may be incurred related to businesses previously acquired or divested in the future; the risk that the anticipated benefits from our PCIe Gen 5 controller products, including higher average selling prices, may not be maintained or may be less than expected; the risk that our anticipated market share gains across our product lines and penetration of enterprise end markets may not materialize as expected or on the anticipated timeline; our ability to successfully develop, introduce, and sell new or enhanced products in a timely manner; and the timing of new product announcements or introductions by us or by our competitors. For additional discussion of these risks and uncertainties and other factors, please see the documents we file from time to time with the U.S. Securities and Exchange Commission, including our Annual Report on Form 20-F filed with the U.S. Securities and Exchange Commission on April 30, 2026. Other than as required under the securities laws, we do not intend, and do not undertake any obligation to, update or revise any forward-looking statements, which apply only as of the date of this news release.

   
Silicon Motion
Investor Contacts:
 
Tom Sepenzis Selina Hsieh
Vice President of Investor Relations & Strategy Investor Relations

[email protected]
[email protected]


First Solar Inaugurates First Phase of South Carolina Production Facility

First Solar Inaugurates First Phase of South Carolina Production Facility

Sixth US facility part of over $5 billion First Solar has invested in American manufacturing and R&D since 2019

GAFFNEY, S.C.–(BUSINESS WIRE)–
First Solar, Inc. (Nasdaq: FSLR) (“First Solar” or “the Company”) today inaugurated the first phase of its new facility in Gaffney, Cherokee County, South Carolina, which onshores final production processes for the Company’s Series 6 Plus modules initiated by the Company’s international fleet. The second phase is forecast to be completed by mid-2027, at which time the approximately $330 million facility is expected to double its annual nameplate capacity to 3.4 gigawatts (GW) and produce the Company’s CuRe technology, while supporting nearly 700 jobs. Approximately 500 of those jobs have already been filled.

This press release features multimedia. View the full release here: https://www.businesswire.com/news/home/20261028826766/en/

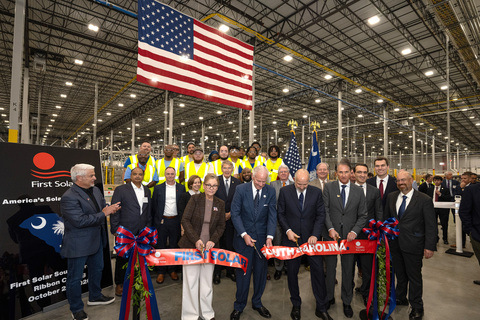
South Carolina Governor Henry McMaster, US Senator Darline Graham, US Secretary of Commerce Howard Lutnick, South Carolina Senator Harvey Peeler, South Carolina Representatives Dennis Moss and Brian Lawson, and Gaffney Mayor Lyman D. Dawkins III joined First Solar Chief Executive Officer Mark Widmar, employees, and community leaders for the ribbon-cutting ceremony for First Solar’s new Gaffney, South Carolina facility.

South Carolina Governor Henry McMaster, US Senator Darline Graham, US Secretary of Commerce Howard Lutnick, South Carolina Senator Harvey Peeler, South Carolina Representatives Dennis Moss and Brian Lawson, and Gaffney Mayor Lyman D. Dawkins III joined First Solar Chief Executive Officer Mark Widmar, employees, and community leaders for the ribbon-cutting ceremony for First Solar’s new Gaffney, South Carolina facility.

South Carolina Governor Henry McMaster, US Senator Darline Graham, US Secretary of Commerce Howard Lutnick, South Carolina Senator Harvey Peeler, South Carolina Representatives Dennis Moss and Brian Lawson, and Gaffney Mayor Lyman D. Dawkins III joined First Solar Chief Executive Officer Mark Widmar, employees, and community leaders for the ribbon-cutting ceremony.

“Thanks to First Solar’s investment, South Carolinians are building American energy technology in Gaffney, with nearly 700 good-paying jobs expected to support this critical work,” said Governor McMaster. “This is another example of why South Carolina continues to be recognized as a manufacturing powerhouse and a leader in our nation’s energy future.”

“I’m proud to see First Solar’s investment in South Carolina, which supports an America-first, affordable energy agenda. First Solar is showing their vote of confidence in hardworking South Carolinians, and we welcome their investment. Good paying jobs provide solid foundations for families and communities right here in Cherokee County,” said Senator Graham.

“First Solar is winning in America because they’ve invented their own technology, they’re building their own technology, and they’re building it in South Carolina,” said Secretary Lutnick. “It’s exceptional American technology produced by great American workers. That’s what we’re driving for, and that’s why we’re here today.”

“When we invest in jobs, we’re investing in possibilities for our people. And it doesn’t stop with the folks who work at First Solar. It reaches the small businesses that are the backbone of our community. Thank you for planting your flag in Gaffney and showing everyone that greatness is already here,” said Mayor Dawkins.

“Less than a year after we selected Gaffney, this facility is ready to produce American solar technology, built by South Carolinian workers,” said Widmar. “That pace reflects what is possible when sound policy, strong state and local partners, and a committed workforce align. Every module that leaves this facility is made without dependence on Chinese crystalline silicon supply chains, and it strengthens our ability to deliver the certainty our customers need as American electricity demand grows.”

The South Carolina facility, which supports American energy dominance and affordability goals, was catalyzed by demand for domestically produced energy technology created by the Administration’s trade policies and the One Big Beautiful Bill Act, signed into law by President Donald J. Trump in July 2025.

The new facility expands First Solar’s footprint in South Carolina, which also includes a distribution center in Duncan, Spartanburg County, and a longstanding partnership with Inland Port Greer. First Solar already operates the largest solar technology manufacturing and research and development (R&D) footprint in the Western Hemisphere, with manufacturing facilities in Alabama, Louisiana, and Ohio, in addition to South Carolina, and R&D centers in Ohio and California. By the end of 2026, the Company expects to have invested over $5 billion in American manufacturing and R&D infrastructure since 2019, and by 2027 it forecasts approximately 17 GW of US module manufacturing capacity, none of which has any dependence on Chinese crystalline silicon supply chains.

Having manufactured in the US since 2002, First Solar is the country’s leading PV solar technology and manufacturing company and the only one of the world’s largest solar manufacturers to be headquartered in the US. A study commissioned by First Solar and conducted by the University of Louisiana at Lafayette estimated that the Company supported nearly 30,000 American jobs and $3.0 billion in labor income in 2025, while contributing approximately $5.8 billion to US gross domestic product (GDP). The analysis projects that by 2027 the Company will support more than 39,000 jobs and $4.0 billion in labor income and contribute approximately $7.8 billion to US GDP.

About First Solar, Inc.

First Solar, Inc. is America’s leading PV solar technology and manufacturing company. The only US-headquartered company among the world’s largest solar manufacturers, First Solar is focused on competitively and reliably enabling power generation needs with its advanced, uniquely American thin film PV technology. Developed at research and development (R&D) labs in California and Ohio, the Company’s technology provides a competitive, high-performance, and responsibly produced alternative to conventional crystalline silicon PV modules. For more information, please visit www.firstsolar.com.

Cautionary Statement Regarding Forward-Looking Statements

This press release contains various “forward-looking statements” which are made pursuant to safe harbor provisions of the Private Securities Litigation Reform Act of 1995. These forward-looking statements include, but are not limited to, statements concerning expectations that (i) the second phase of the Gaffney facility will be completed by mid-2027, will produce solar panels with CuRe technology, and support nearly 700 jobs; (ii) First Solar will have a total US nameplate capacity of approximately 17 GW by 2027; and (iii) First Solar will have invested over $5 billion in American manufacturing and R&D infrastructure from 2019 to 2026. These forward-looking statements are often characterized by the use of words such as “estimate,” “expect,” “anticipate,” “project,” “plan,” “intend,” “seek,” “believe,” “forecast,” “foresee,” “likely,” “may,” “should,” “goal,” “target,” “might,” “will,” “could,” “predict,” “continue” and the negative or plural of these words and other comparable terminology. Forward-looking statements are only predictions based on First Solar’s current expectations and First Solar’s projections about future events and therefore speak only as of the date of this release. You should not place undue reliance on these forward-looking statements. First Solar undertakes no obligation to update any of these forward-looking statements for any reason, whether as a result of new information, future developments or otherwise. These forward-looking statements involve known and unknown risks, uncertainties, and other factors that may cause First Solar’s actual results, levels of activity, performance, or achievements to differ materially from those expressed or implied by these statements. These factors include, but are not limited to, the results of our investigation of potential infringers, and the costs and other impacts arising from any subsequent litigation, the results of which are unpredictable; the validity and scope of claims relating to the patents; the potential for companies to develop and patent technology designed to exclude our patented technology; and the matters discussed under the captions “Risk Factors” and “Management’s Discussion and Analysis of Financial Condition and Results of Operations” of First Solar’s most recent Annual Report on Form 10-K, as supplemented by First Solar’s other filings with the Securities and Exchange Commission.

This press release contains references to data and information generated by an economic study conducted by the Kathleen Babineaux Blanco Public Policy Center at the University of Louisiana at Lafayette and commissioned by First Solar. The study is based on numerous assumptions, estimates and other data as more fully described in the report summarizing the study’s findings, which is available at www.firstsolar.com/USeconomy.


Media

Reuven Proença

First Solar Media

[email protected]

Investors

Byron Jeffers

First Solar Investor Relations

[email protected]

KEYWORDS: South Carolina United States North America

INDUSTRY KEYWORDS: Machine Tools, Metalworking & Metallurgy White House/Federal Government Public Policy/Government State/Local Manufacturing Alternative Energy Energy

MEDIA:

Photo
Photo
South Carolina Governor Henry McMaster, US Senator Darline Graham, US Secretary of Commerce Howard Lutnick, South Carolina Senator Harvey Peeler, South Carolina Representatives Dennis Moss and Brian Lawson, and Gaffney Mayor Lyman D. Dawkins III joined First Solar Chief Executive Officer Mark Widmar, employees, and community leaders for the ribbon-cutting ceremony for First Solar’s new Gaffney, South Carolina facility.
Photo
Photo
US Commerce Secretary Howard Lutnick (right) and First Solar CEO Mark Widmar (center) with First Solar employees on the floor of the company’s new facility in Gaffney, South Carolina.
Logo
Logo

Update to Previously Announced Special Dividend and Monthly Dividend

Update to Previously Announced Special Dividend and Monthly Dividend

NEW YORK–(BUSINESS WIRE)–
Saba Capital Income & Opportunities Fund II (NYSE: SABA) (the “Fund”), a registered closed-end management investment company listed on the New York Stock Exchange, previously announced: (a) on October 1, 2026 a regular dividend (the “October Regular Dividend”) of $0.058 per share, declared on September 30, 2026, and payable on October 30, 2026 to shareholders of record as of October 9, 2026 and (b) on October 27, 2026, a special dividend (the “October Special Dividend”) of $0.155 per share, declared on October 27, 2026, and payable on October 30, 2026 to shareholders of record as of October 29, 2026. With respect to the form of payment, the Fund is providing notice that each of the October Regular Dividend and October Special Dividend will be paid in cash only to all shareholders of record entitled to receive such payment.

Managed Distribution Plan. In accordance with the Fund’s currently effective managed distribution plan (the “Plan”), the Fund will make monthly distributions to shareholders at a fixed amount of $0.058 per share. Special dividends are not paid pursuant to the Plan, and thus, the special distribution amount shown is in addition to the Fund’s monthly distributions to shareholders. The Fund may or may not declare special distributions in the future. The Fund will generally distribute amounts necessary to satisfy the Fund’s Plan and the requirements of Subchapter M of the Internal Revenue Code.

Under the Plan, to the extent that sufficient investment income is not available on a monthly basis, the Fund will distribute long-term capital gains and/or return of capital in order to maintain its managed distribution rate. As a result, long-term capital gains and/or return of capital may be a material source of any distribution. No conclusions should be drawn about the Fund’s investment performance from the amount of the Fund’s distributions or from the terms of the Fund’s Plan. The Board of Trustees (the “Board”) may amend the terms of the Plan or terminate the Plan at any time without prior notice to Fund shareholders. No level of distribution can be guaranteed. The amendment or termination of the Plan could have an adverse effect on the market price of the Fund’s common shares. The Plan is subject to the periodic review by the Board, including a yearly review of the annual minimum fixed rate to determine if an adjustment should be made.

In compliance with Rule 19a-1 of the Investment Company Act of 1940, shareholders will receive a notice that details the source of income for the above dividend, such as net investment income, gain from the sale of securities and return of principal; however, determination of the actual source of the foregoing dividend can only be made at year-end. The actual source amounts of all Fund dividends will be included in the Fund’s annual or semiannual reports. In addition, the tax treatment may differ from the accounting treatment used to calculate the source of the Fund’s dividends as shown on shareholders’ statements. Shareholders should refer to their Form 1099-DIV for the character and amount of distributions for income tax reporting purposes. Since each shareholder’s tax situation is unique, it may be advisable to consult a tax advisor as to the appropriate treatment of Fund distributions.

Past Performance is No Assurance of Future Results. Investment return and principal value of an investment in the Fund will fluctuate. Shares, when sold, may be worth more or less than their original cost. Investors should consider the investment objective, risks and expenses carefully. You can obtain the Fund’s most recent periodic reports and filings by visiting https://www.sec.gov/edgar/browse/?CIK=828803&owner=exclude.

Other Information and Certain Risk Factors: The Fund’s investment objective is to provide investors with high current income, with a secondary goal of capital appreciation. There can be no assurance that the Fund will meet its investment objective. The Fund seeks to achieve this objective by investing globally in debt and equity securities of public and private companies, which includes, among other things, investments in closed‐end funds, special purpose acquisition companies (“SPACs”), reinsurance, and public and private debt instruments. The Fund also may utilize derivatives including but not limited to total return swaps, credit default swaps, options and futures, in seeking to enhance returns and/or to reduce portfolio risk.

The value of the Fund’s investments in equity securities of public and private, listed and unlisted companies and equity derivatives generally varies with the performance of the issuer and movements in the equity markets more generally. As a result, the Fund may suffer losses if it invests in equity instruments of issuers whose performance diverges from the Fund’s investment manager’s expectations or if equity markets generally move in a single direction and the Fund has not hedged against such a general move. The Fund invests in closed-end funds and SPACs, which are subject to additional risks and considerations. The performance of reinsurance-related securities and the reinsurance industry itself are tied to the occurrence of various triggering events, including but not limited to weather, natural disasters (hurricanes, earthquakes, etc.), non-natural large catastrophes and other specified events causing physical and/or economic loss. To the extent the Fund invests in reinsurance-related securities for which a triggering event occurs, losses associated with such event could result in losses to the Fund’s investment, and a series of major triggering events affecting a large portion of the reinsurance- related securities held by the Fund could result in substantial losses to the Fund’s investment. The Fund may invest in high yield securities, which are speculative in nature and are subject to additional risk factors such as increased possibility of default, illiquidity of the security, and changes in value based on changes in interest rates. Changes in short-term market interest rates may directly affect the yield on the Fund’s common shares. If such rates fall, the Fund’s yield may also fall. If interest rate spreads on bonds and loans owned by the Fund decline in general, the yield on the bonds and loans will likely fall and the value of such bonds and loans may decrease. When short-term market interest rates rise, because of the lag between changes in such short-term rates and the resetting of the floating rates on bonds and loans in the Fund’s portfolio, the impact of rising rates will be delayed to the extent of such lag. Because of the limited secondary market for certain bonds and loans, the Fund’s ability to sell such securities in a timely fashion and/or at a favorable price may be limited. An increase in the demand for bonds and loans may adversely affect the rate of interest payable on new bonds and loans acquired by the Fund, and it may also increase the price of bonds and loans purchased by the Fund in the secondary market. A decrease in the demand for bonds and loans may adversely affect the price of bonds and loans in the Fund’s portfolio, which would cause the Fund’s net asset value to decrease. Investment in foreign borrowers involves special risks, including but not limited to potentially less rigorous accounting requirements, differing legal systems and potential political, social and economic adversity. The Fund may engage in currency exchange transactions to seek to hedge, as closely as practicable, all of the economic impact to the Fund arising from foreign currency fluctuations. Other risks include, but are not limited to, the use of derivatives, the potential lack of diversification in the Fund’s portfolio, and the fact that the Fund’s portfolio may be concentrated in a small group of industries or industry sectors from time to time. Investors should consult the Fund’s filings with the Securities and Exchange Commission as well as the materials on the Fund’s website for a more detailed discussion of these or other risk factors that affect the Fund.

About Saba Capital Income & Opportunities Fund II. Saba Capital Income & Opportunities Fund II is a publicly-traded registered closed-end management investment company. The Fund’s common shares trade on the New York Stock Exchange under the ticker symbol “SABA”. The Fund is managed by Saba Capital Management, L.P.

Forward-Looking Statements. This press release contains forward-looking statements subject to the inherent uncertainties in predicting future results and conditions. Any statements that are not statements of historical fact (including but not limited to statements containing the words “believes,” “plans,” “anticipates,” “expects,” “estimates” and similar expressions) should also be considered to be forward-looking statements. These statements are not guarantees of future performance, conditions or results and involve a number of risks and uncertainties. Certain factors could cause actual results and conditions to differ materially from those projected in these forward-looking statements. These factors, including but not limited to the “Certain Risk Factors” noted above, are identified from time to time in the Fund’s filings with the Securities and Exchange Commission as well as the materials on the Fund’s website. The Fund undertakes no obligation to update such statements to reflect subsequent events, except as may be required by law.

For further information on Saba Capital Income & Opportunities Fund II, please visit our website at: www.sabacef.com.

888-888-0319

KEYWORDS: New York United States North America

INDUSTRY KEYWORDS: Asset Management Professional Services Finance

MEDIA:

Forestar Group Inc. Announces Retirement of Donald J. Tomnitz as Executive Chairman and Appointment of Anthony W. Oxley as Executive Chairman and Chief Executive Officer

Forestar Group Inc. Announces Retirement of Donald J. Tomnitz as Executive Chairman and Appointment of Anthony W. Oxley as Executive Chairman and Chief Executive Officer

ARLINGTON, Texas–(BUSINESS WIRE)–
Forestar Group Inc. (NYSE: FOR) today announced that Donald (Don) J. Tomnitz will retire as Executive Chairman of the Company’s Board of Directors, effective October 31, 2026. Anthony (Andy) W. Oxley, who currently serves as President and Chief Executive Officer, will assume the additional role of Executive Chairman, effective November 1, 2026.

Tomnitz has served as Executive Chairman of Forestar since October 2017 and has been instrumental in guiding the Company’s strategic direction and significant growth. He will remain in a consulting role with the Company for two years. Oxley has served as President and Chief Executive Officer since January 2024 and will continue to lead Forestar’s management team in his expanded role.

Don Tomnitz, outgoing Executive Chairman, said, “It has been an honor to help lead Forestar, and I am proud of our team and the Company we have built together over the years. Forestar is well-positioned for long-term growth and success, with strong leaders across the Company. I am confident Andy and the leadership team will continue to successfully guide Forestar’s future.”

Andy Oxley, President and Chief Executive Officer, said, “I greatly appreciate Don for his leadership and friendship throughout my career and his dedication to Forestar over the past nine years. He has helped build a strong foundation for our Company, and I am grateful for his many contributions. I look forward to working with the rest of the Forestar team to continue growing and improving the Company to become the leading residential lot developer in America.”

About Forestar Group Inc.

Forestar Group Inc. is a residential lot development company with operations in 65 markets and 24 states. Based in Arlington, Texas, the Company delivered more than 13,400 residential lots during the twelve-month period ended June 30, 2026. Forestar is a majority-owned subsidiary of D.R. Horton, Inc., the largest homebuilder by volume in the United States since 2002.

Chris Hibbetts, 817-769-1860

Vice President of Finance & Investor Relations

[email protected]

KEYWORDS: Texas United States North America

INDUSTRY KEYWORDS: Residential Building & Real Estate Commercial Building & Real Estate Construction & Property

MEDIA:

Logo
Logo

Deutsche Bank appointed as Successor Depositary Bank for the American Depositary Receipt Program of Aviva plc

Deutsche Bank appointed as Successor Depositary Bank for the American Depositary Receipt Program of Aviva plc

NEW YORK–(BUSINESS WIRE)–
Deutsche Bank announced today its appointment as successor depositary bank for the sponsored American Depositary Receipt program of Aviva plc.

Aviva plc (OTC: AVVIY) is a financial services company with a diverse offering across insurance, wealth and retirement. This includes motor and home insurance, health and protection insurance, pensions and savings products, and more. Aviva serves over 25 million customers across the UK, Ireland and Canada. They employ around 36,000 people globally and their headquarters is in London.*

In addition to specializing in administering cross-border equity structures such as New York Shares and American and Global Depositary Receipts, Deutsche Bank provides corporates, financial institutions, hedge funds and supranational agencies around the world with trustee, agency, escrow and related services. Deutsche Bank offers a very broad range of services for diverse products, from complex securitizations and project finance to syndicated loans, debt exchanges and restructurings.

* This information was provided by Aviva plc (October 2026).

Depositary Receipt Information

Depositary Receipt Contacts

Country

United Kingdom

New Business

Development

Matt Edmund


Custodian Bank

Deutsche Bank AG London Branch

21 Moorfields,

EC2Y 9DB,

London,

United Kingdom


Tel: +44 20 7545 1096


www.adr.db.com

Markets Distribution


[email protected]

London

Effective Date

October 28, 2026


Tel: +44 (0) 20 7547 6500


New York

Level I ADR


Tel: +1 212 250 9100

CUSIP

05382A302


ISIN

US05382A3023


Symbol

AVVIY


Exchange

OTC


Current Ratio

1 ADS: 2 ordinary shares


Eligibility

DTC


Deutsche Bank provides commercial and investment banking, retail banking, transaction banking and asset and wealth management products and services to corporations, governments, institutional investors, small and medium-sized businesses, and private individuals. Deutsche Bank is Germany’s leading bank, with a strong position in Europe and a significant presence in the Americas and Asia Pacific.

The Depositary Receipts have been registered pursuant to the US Securities Act of 1933 (the “Act”). The investment or investment service which is the subject of this notice is not available to retail clients as defined by the UK Financial Conduct Authority. This notice has been approved and/or communicated by Deutsche Bank AG New York. The services described in this notice are provided by Deutsche Bank Trust Company Americas (Deutsche Bank) or by its subsidiaries and/or affiliates in accordance with appropriate local registration and regulation. Deutsche Bank is providing the attached notice strictly for information purposes and makes no claims or statement, nor does it warrant or in any way represent, as to the accuracy or completeness of the details contained herein or therein. This announcement appears as a matter of record only. Neither this announcement nor the information contained herein constitutes an offer or solicitation by Deutsche Bank or any other issuer or entity for the purchase or sale of any securities nor does it constitute a solicitation to any person in any jurisdiction where solicitation would be unlawful. No part of this notice may be copied or reproduced in any way without the prior written consent of Deutsche Bank. Past results are not an indication of future performance. Copyright© October 2026 Deutsche Bank AG. All rights reserved.

Deutsche Bank AG

Press & Media Relations

Meredith Zaritheny

Tel.: +19297424613

Email: [email protected]

KEYWORDS: New York United States North America

INDUSTRY KEYWORDS: Banking Professional Services Finance

MEDIA:

Logo
Logo

Algoma Steel Group Inc. Reports Financial Results for the Three Months Ended September 30, 2026


Adjusted EBITDA Loss of $13.9 Million, In Line with Previously Announced Expectations


Lake Superior Power Restored to Full Power Following Third Quarter Turbine Outage


EAF Unit Two Produces First Steel; Ramp-Up Underway

SAULT STE. MARIE, Ontario, Oct. 28, 2026 (GLOBE NEWSWIRE) — Algoma Steel Group Inc. (NASDAQ: ASTL; TSX: ASTL) (“Algoma” or “the Company”), a leading Canadian producer of steel plate and hot-rolled sheet products, today announced results for the three-month period ended September 30, 2026.

Unless otherwise specified, all amounts are in Canadian dollars.

Business Highlights and Third Quarter 2026 to Third Quarter 2025 Comparisons

Comparisons between Q3 2026 and Q3 2025 were significantly impacted by the transition from legacy blast furnace operations to the Company’s Electric Arc Furnace (“EAF”) platform. In the prior-year quarter, the Company produced steel predominantly from its legacy blast furnace operations, which were permanently halted on January 18, 2026. In the third quarter of 2026, all liquid steel production was sourced from the Company’s first EAF unit, which continues to ramp up.

  • Consolidated revenue of $249.4 million, compared to $523.9 million in the prior-year quarter.
  • Consolidated loss from operations of $94.5 million, compared to a loss from operations of $651.5 million in the prior-year quarter, which included the impact of a $503.4 million non-cash impairment charge.
  • Net loss of $129.6 million, compared to a net loss of $485.1 million in the prior-year quarter.
  • Adjusted EBITDA loss of $13.9 million and Adjusted EBITDA margin of (5.6%), which excludes $53.1 million of capacity utilization costs, compared to an Adjusted EBITDA loss of $87.1 million and Adjusted EBITDA margin of (16.6%) in the prior-year quarter. See “Non-GAAP Financial Measures” below.
  • Direct tariff costs of $18.1 million, compared to $89.7 million in the prior-year quarter.
  • Cash generated by operating activities of $78.6 million, including the collection of $163.9 million of income taxes receivable, compared to cash used in operating activities of $117.3 million in the prior-year quarter.
  • Shipments of 144,527 tons, compared to 419,173 tons in the prior-year quarter, reflecting the transition to EAF-only steelmaking, the impact of the U.S. Section 232 tariffs on export sales, and the Lake Superior Power (“LSP”) outage.

Rajat Marwah, the Company’s Chief Executive Officer, commented, “Earlier this month, we produced first steel at EAF Unit Two, a major milestone for Algoma and the result of years of disciplined execution by our employees and contractors. Our plate-first strategy continued to drive results, with higher steel prices and a greater share of plate driving stronger net sales realization per ton. With both units now in place and power fully restored at Lake Superior Power following a temporary outage in August, we are entering the final phase of the most significant transformation in Algoma’s history.”

Mr. Marwah continued, “While the 50% U.S. Section 232 tariffs continue to severely restrict our traditional access to the U.S. market, our pivot to a Canada-centric, plate-first strategy is helping us navigate these challenges. With both EAF units in place, we are well-positioned to increase production and meet growing infrastructure, construction, and defence demand. We applaud the federal and Ontario governments for last week’s steel support announcement, a decisive step to strengthen and diversify Canadian steel and the domestic market our plate-first strategy serves. We are grateful for their continued partnership as we build a stronger, more sustainable Canadian steel industry.”

Michael Moraca, the Company’s Chief Financial Officer, commented, “Adjusted EBITDA loss of $13.9 million came in line with our previously disclosed guidance, as higher steel prices, a greater share of plate, and lower fixed costs helped offset the temporary impact of the LSP outage. Average net sales realization per ton increased 33.7% versus the prior-year quarter, reflecting stronger steel prices and a greater proportion of plate in our sales mix. We ended the quarter with approximately $428 million in total available liquidity. After quarter end, we also resolved our dispute with Haverhill, closing out one of the legacy matters from the transition. With both EAF units now in place, we are focused on disciplined execution as we ramp up and build toward improved profitability.”

Third Quarter 2026 Financial Results

Third quarter revenue totaled $249.4 million, compared to $523.9 million in the prior-year quarter. Steel revenue, net of freight, was $218.2 million, compared to $473.3 million in the prior-year quarter. Average net sales realization per ton of steel sold was $1,510, compared to $1,129 in the prior-year quarter, an increase of 33.7%, reflecting higher steel prices and a higher proportion of plate in the sales mix.

Loss from operations was $94.5 million, compared to a loss of $651.5 million in the prior-year quarter. The year-over-year improvement was primarily due to the $503.4 million non-cash impairment loss recognized in the prior-year quarter. Higher steel prices, increased plate shipment volume, lower labour and other fixed costs, and a $13.8 million decrease in administrative and selling expenses also contributed to results, partially offset by lower steel shipments primarily due to the accelerated transition to EAF steelmaking, the U.S. Section 232 tariffs, which significantly restricted the Company’s historical U.S. export business, and the LSP outage.

Net loss in the third quarter was $129.6 million, compared to a net loss of $485.1 million in the prior-year quarter. The decrease primarily reflects the lower loss from operations, partially offset by a $144.0 million decrease in income tax recovery and a foreign exchange loss of $10.0 million, compared to a foreign exchange gain of $14.3 million in the prior-year quarter.

Adjusted EBITDA loss in the third quarter was $13.9 million, resulting in an Adjusted EBITDA margin of (5.6%). This compares to an Adjusted EBITDA loss of $87.1 million, or an Adjusted EBITDA margin of (16.6%), in the prior-year quarter. The year-over-year improvement was primarily due to increased plate shipment volume, both in aggregate and as a percentage of sales, and lower labour and other fixed costs, partially offset by lower steel shipments. Adjusted EBITDA in the quarter includes the benefit of a $53.1 million capacity utilization adjustment.

Cost per ton of steel products sold was $1,492, compared to $1,282 in the prior-year quarter, primarily reflecting lower fixed-cost absorption at reduced production volumes and a higher proportion of plate in the shipment mix. Shipments for the third quarter decreased by 65.5% to 144,527 tons, compared to 419,173 tons in the prior-year quarter.

See “Non-GAAP Financial Measures” below for an explanation of Adjusted EBITDA, Adjusted EBITDA margin, Average Net Sales Realization and Cost Per Ton of Steel Products Sold and a reconciliation of net loss to Adjusted EBITDA.

Lake Superior Power Outage

On August 17, 2026, the Company experienced an unplanned outage at its LSP generating facility. One of the LSP turbine units detected an abnormal condition and was automatically taken offline. The remaining LSP units were not affected. As LSP supplies electricity to the Company’s steelmaking operations, the outage required a temporary suspension of EAF production. The Company worked closely with the Independent Electricity System Operator (“IESO”) to implement interim operating arrangements, enabling EAF production to resume on August 29, 2026, while the affected LSP turbine remained unavailable. Following the restart, these arrangements supported sustained production, including during certain planned work on the provincial electricity system.

On September 30, 2026, the Company commissioned a newly acquired replacement turbine, restoring full generating capability at LSP. The acquisition provides the Company with additional operational flexibility and strengthens the reliability of its power generation infrastructure.

The Company has exercised its option under its existing Contract Service Agreement with GE to bring a leased turbine into service while repairs to the affected turbine are undertaken. Installation of the leased turbine is expected to be completed during the fourth quarter of 2026 and is not expected to result in any interruption to steelmaking operations. Upon installation, the newly acquired turbine will serve as a ready spare, providing additional equipment redundancy and enhancing operational resilience. Following completion of repairs to the affected turbine, the additional generating equipment is expected to provide further operational flexibility and the potential to support expanded power generation capacity in the future.

The replacement turbine was purchased during the three-month period ended September 30, 2026. The Company is currently pursuing four-year term financing for the replacement turbine.

Electric Arc Furnace

During the quarter, the Company completed first arc testing at its second EAF unit. Subsequent to quarter end, Unit Two produced its first heat of liquid steel on October 9, 2026, which was processed into finished hot-rolled coil. Ramp-up activities are progressing as expected. With both units now in place, Algoma is focused on ramping up its two-unit EAF platform, with Unit Two expected to contribute to production and shipments in the fourth quarter of 2026. Unit One continues to perform well, operating on a full 24-hour-per-day schedule and achieving quality metrics across a range of plate and hot-rolled coil product grades.

As Canada’s only producer of discrete plate, the Company holds a unique competitive position in the market. Plate shipment volume increased both in aggregate and as a percentage of sales compared to the prior-year quarter. With both units in place, the Company is positioned to increase production toward full capacity to serve growing infrastructure, construction, and defence demand.

Following completion of the EAF transformation, Algoma’s facility is expected to have an annual raw steel production capacity of approximately 3.7 million tons and is projected to reduce annual carbon emissions by approximately 70% from pre-EAF levels.

Trade Environment and Strategic Response

The 50% U.S. Section 232 tariff on steel imports from Canada remained in effect during the third quarter, with expanded product coverage across downstream and derivative steel products. The tariff continued to have a sustained and material adverse impact on Canadian producers’ access to the U.S. market. The Company incurred $18.1 million in direct tariff costs in the quarter, compared to $89.7 million in the prior-year quarter, reflecting the deliberate reduction of U.S.-bound volumes. Shipments to the United States represented 24% of total steel shipments in the quarter, compared to 50% in the prior-year quarter.

While Canadian pricing has improved, the Canadian steel market remains supply-pressured. This reflects increased supply from domestic producers, the continued shipment of U.S. steel into Canada, and import offers from offshore producers at prices the Company believes to be below fair market value. Algoma’s strategic response is to concentrate production on discrete plate, where it benefits from a pricing premium and a unique market position. This strategy is designed to mitigate these dynamics.

The Company continues to advance Roshel Algoma Defence, its joint venture with Roshel Inc. formed in April 2026. The joint venture is expected to support the development of domestic ballistic steel and related manufacturing capabilities in Canada.

Liquidity

At September 30, 2026, the Company had cash of $152.4 million, unused availability under its Revolving Credit Facility of $232.5 million, and $43.5 million available to draw under the LETL Facilities, for total available liquidity of approximately $428 million. During the third quarter, the Company received $124.5 million in governmental loan advances under the LETL Facilities to support operations and the completion of the EAF transition. Capital expenditures in the quarter were $67.7 million, compared to $52.4 million in the prior-year quarter, reflecting final construction spending on EAF Unit Two, which was completed in October. No dividends were declared during the quarter.

Settlement of Coke Supply Dispute

In October 2026, the Company entered into a negotiated settlement agreement with Haverhill Coke Company LLC and certain related parties, resolving the outstanding commercial dispute relating to historical coke supply arrangements. The settlement represents a mutually acceptable commercial resolution of the dispute and was reached without any admission of liability or wrongdoing by either party. 

Conference Call and Webcast Details

A webcast and conference call will be held on Thursday, October 29, 2026 at 11:00 a.m. EDT to review the Company’s results for the three-month period ended September 30, 2026, discuss recent events, and conduct a question-and-answer session.

The live webcast and archived replay of the conference call can be accessed on the Investors section of the Company’s website at ir.algoma.com. For those unable to access the webcast, the conference call will be accessible domestically or internationally by dialing 877-425-9470 or 201-389-0878, respectively. Upon dialing in, please request to join the Algoma Steel Third Quarter 2026 Conference Call. To access the replay of the call, dial 844-512-2921 (domestic) or 412-317-6671 (international) and enter passcode 13763166.

Consolidated Financial Statements and Management’s Discussion and Analysis

The Company’s condensed interim consolidated financial statements for the three- and nine-month periods ended September 30, 2026 and Management’s Discussion and Analysis thereon are available under the Company’s profile on the U.S. Securities and Exchange Commission’s (“SEC”) EDGAR website at www.sec.gov and under the Company’s profile on SEDAR+ at www.sedarplus.ca. These documents are also available on the Company’s website, www.algoma.com, and shareholders may receive hard copies of such documents free of charge upon request by contacting [email protected].

Cautionary Statement Regarding Forward-Looking Statements

This news release contains “forward-looking information” under applicable Canadian securities legislation and “forward-looking statements” within the meaning of the U.S. Private Securities Litigation Reform Act of 1995 (collectively, “forward-looking statements”), including statements regarding imposed and threatened tariffs, including the impact, timing and resolution thereof, trends in the pricing of steel and conditions in the Canadian steel market, Algoma’s transition to EAF steelmaking and the expected benefits thereof, the expected ramp-up of EAF Unit Two and the timing of its contribution to production and shipments, the Company’s ability to increase production toward full capacity, expected demand from infrastructure, construction, and defence sectors, the installation of a leased turbine at Lake Superior Power, including the expected timing thereof and the expectation that it will not interrupt steelmaking operations, the expected benefits of the replacement and leased turbines and the potential expansion of power generation capacity, the expected financing of the replacement turbine, the Company’s expected annual raw steel production capacity and reduction in carbon emissions, the Company’s plate-first strategy and its expected benefits, the potential impact of government steel support measures, Algoma’s future as a leading producer of green steel, the potential impacts of inflationary pressures, the Company’s ability to preserve and strengthen near-term liquidity and financial flexibility, availability and receipt of governmental funding and support, the potential benefits of the Roshel Algoma Defence joint venture and sovereign ballistic steel capabilities, labour availability, the impact of global supply chain disruptions on costs, the Company’s ability to improve profitability, and the Company’s strategy, plans or future financial or operating performance. These forward-looking statements generally are identified by the words “believe,” “project,” “expect,” “anticipate,” “estimate,” “intend,” “strategy,” “future,” “opportunity,” “plan,” “may,” “should,” “will,” “would,” “will be,” “will continue,” “will likely result,” “positioned,” and similar expressions. Forward-looking statements are predictions, projections and other statements about future events that are based on current expectations and assumptions, including assumptions regarding the successful ramp-up of the EAF platform, the reliability of power supply, the availability of financing on acceptable terms, steel prices and demand, and the tariff and trade environment. Many factors could cause actual future events to differ materially from the forward-looking statements in this document, including those set forth in “Risk Factors” and “Cautionary Note Regarding Forward-Looking Information” in Algoma’s Annual Information Form, filed under the Company’s SEDAR+ profile at www.sedarplus.ca and with the SEC as part of Algoma’s Annual Report on Form 40-F at www.sec.gov, and in the Company’s Management’s Discussion and Analysis for the three- and nine-month periods ended September 30, 2026. Forward-looking statements speak only as of the date they are made. Algoma assumes no obligation and does not intend to update or revise these forward-looking statements, whether as a result of new information, future events, or otherwise, except as required by applicable law.

Non-GAAP Financial Measures

To supplement our financial statements, which are prepared in accordance with IFRS® Accounting Standards as issued by the International Accounting Standards Board (“IASB”) (“IFRS Accounting Standards”), we use certain non-GAAP measures to evaluate the performance of Algoma. These terms do not have any standardized meaning prescribed within IFRS Accounting Standards and, therefore, may not be comparable to similar measures presented by other companies. Rather, these measures are provided as additional information to complement those IFRS Accounting Standards measures by providing a further understanding of our financial performance from management’s perspective.

Adjusted EBITDA refers to net income or loss before depreciation of property, plant and equipment and amortization of intangible assets, finance costs, interest on pension and other post-employment benefit obligations and income taxes, foreign exchange loss (gain), finance income, carbon tax, changes in fair value of IPO and LETL Warrants, earnout rights, share-based compensation liabilities, share-based compensation related to the Company’s Omnibus Long Term Incentive Plan, derivatives, certain inventory adjustments, impairment loss, legal settlements, fees and legacy contracts, severance costs, stranded inventory and capacity utilization. Adjusted EBITDA margin is calculated by dividing Adjusted EBITDA by revenue for the corresponding period. Adjusted EBITDA is not intended to represent cash flow from operations, as defined by IFRS Accounting Standards. We consider Adjusted EBITDA to be a meaningful measure to assess our operating performance in addition to IFRS Accounting Standards. Average Net Sales Realization refers to steel revenue less freight revenue per steel tons shipped. Cost Per Ton of Steel Products Sold refers to cost of steel revenue less freight, depreciation, capacity utilization, legal settlements, fees and legacy contracts and carbon tax (included in cost of steel revenue) per steel tons shipped. See the financial tables below for a reconciliation of net loss to Adjusted EBITDA.

About Algoma Steel

Based in Sault Ste. Marie, Ontario, Algoma is a leading Canadian producer of high-quality plate and sheet steel products, proudly supporting critical sectors including energy, defence, automotive, shipbuilding, and infrastructure. Guided by a purpose to build better lives and a greener future, Algoma is shaping the next generation of sustainable steelmaking in Canada.

With the transition to electric arc furnace (EAF) steelmaking and a modernized plate mill, Algoma is redefining how steel is made in Canada. Powered by Ontario’s clean electricity grid, this transformation represents one of the largest industrial decarbonization initiatives in North America and is expected to reduce carbon emissions by approximately 70% once fully transitioned. These advancements provide stability for continued investment in diversification projects aligned with Canada’s evolving needs.

This new chapter also introduces Volta™, the brand for all steel produced through Algoma’s EAF technology. Volta delivers the same trusted performance customers rely on, with significantly lower emissions—produced safely, sustainably, and proudly in Canada.

Building on more than a century of steelmaking expertise, Algoma continues to invest in its people, processes, and technologies to strengthen domestic supply chains and deliver responsible, Canadian-made steel that helps build a better tomorrow.

For more information, please contact:

Michael Moraca

Chief Financial Officer
Algoma Steel Group Inc.
Phone: 705.945.3300
E-mail: [email protected]

     
Algoma Steel Group Inc.
Condensed Interim Consolidated Statements of Financial Position

(Unaudited)
As at, September
30, 2026
December 31,
2025
expressed in millions of Canadian dollars    
Assets    
Current    
Cash $
152.4
  $77.5  
Restricted cash   –     0.1  
Taxes receivable   50.9     206.9  
Accounts receivable, net   167.7     192.7  
Inventories   418.1     569.3  
Prepaid expenses and deposits   37.8     30.4  
Other assets   2.6     5.5  
Total current assets $
829.5
  $1,082.4  
Non-current    
Property, plant and equipment, net $
1,169.3
  $1,029.9  
Intangible assets, net   0.2     0.3  
Other assets   1.1     3.3  
Total non-current assets $
1,170.6
  $1,033.5  
Total assets $
2,000.1
  $2,115.9  
Liabilities and Shareholders’ Equity    
Current    
Bank indebtedness $
0.6
  $170.2  
Accounts payable and accrued liabilities   226.2     203.9  
Taxes payable and accrued taxes   42.2     32.7  
Current portion of other long-term liabilities   4.0     5.8  
Current portion of governmental loans   2.2     14.0  
Current portion of environmental liabilities   4.4     4.7  
Severance cost liability   30.4     45.8  
IPO Warrant liability   0.2     2.5  
Earnout liability   3.5     3.7  
Share-based payment compensation liability   13.8     14.1  
Total current liabilities $
327.5
  $497.4  
Non-current    
Senior secured lien notes $
494.8
  $476.6  
Long-term governmental loans   429.2     192.3  
Accrued pension liability   85.4     153.0  
Accrued other post-employment benefit obligation   183.1     193.0  
Other long-term liabilities   228.3     70.7  
Environmental liabilities   34.7     34.3  
LETL Warrant liability   19.2     7.5  
Total non-current liabilities $
1,474.7
  $1,127.4  
Total liabilities $
1,802.2
  $1,624.8  
Shareholders’ equity    
Capital stock $
982.3
  $975.5  
Accumulated other comprehensive income   494.6     414.4  
Deficit   (1,282.9 )   (897.9 )
Contributed surplus (deficit)   3.9     (0.9 )
Total shareholders’ equity $
197.9
  $491.1  
Total liabilities and shareholders’ equity $
2,000.1
  $2,115.9  


Algoma Steel Group Inc.
Condensed Interim Consolidated Statements of Net Loss

(Unaudited)
  Three months ended
September 30,
  Nine months ended
September 30,
  2026
2025   2026
2025
expressed in millions of Canadian dollars, except for per share amounts          
Revenue $
249.4
  $523.9     $
813.8
  $1,630.7  
           
Operating expenses          
Cost of sales $
326.5
  $640.8     $
1,122.8
  $1,910.7  
Administrative and selling expenses   17.4     31.2       73.2     93.1  
Impairment loss   –     503.4       –     503.4  
Loss from operations ($
94.5
) ($651.5 )   ($
382.2
) ($876.5 )
           
Other (income) and expenses          
Finance income ($
2.3
) ($1.1 )   ($
3.4
) ($6.4 )
Finance costs   24.1     17.0       57.0     53.3  
Interest on pension and other post-employment benefit obligations   3.6     4.0       10.7     11.9  
Foreign exchange loss (gain)   10.0     (14.3 )     (23.1 )   18.1  
Other income   –     –       (47.9 )   (50.0 )
Change in fair value of Initial Public Offering (“IPO”) and Large Enterprise Tariff Loan (“LETL”) Warrant liabilities   0.9     (11.9 )     8.7     (46.4 )
Change in fair value of earnout liability   0.1     (3.0 )     0.1     (6.1 )
Change in fair value of share-based compensation liability   0.4     (11.4 )     0.4     (21.7 )
  $
36.8
  ($20.7 )   $
2.5
  ($47.3 )
Loss before income taxes ($
131.3
) ($630.8 )   ($
384.7
) ($829.2 )
Income tax (recovery) expense   (1.7 )   (145.7 )     0.3     (209.0 )
Net loss ($
129.6
) ($485.1 )   ($
385.0
) ($620.2 )
           
           
Net loss per common share          
Basic and diluted ($
1.18
) ($4.46 )   ($
3.53
) ($5.71 )


Algoma Steel Group Inc.
Condensed Interim Consolidated Statements of Cash Flows

(Unaudited)
    Three months ended
September 30,
  Nine months ended
September 30,
    2026
2025   2026
2025
expressed in millions of Canadian dollars          
  Operating activities          
  Net loss ($
129.6
) ($485.1 )   ($
385.0
) ($620.2 )
  Items not affecting cash:          
  Depreciation of property, plant and equipment and intangible assets   17.7     43.4       74.1     116.6  
  Deferred income tax recovery   –     (105.3 )     –     (106.8 )
  Pension funding in excess of expense   (2.5 )   (3.1 )     (9.2 )   (8.2 )
  Post-employment benefit funding in excess of expense   (2.5 )   (2.2 )     (6.6 )   (5.6 )
  Unrealized foreign exchange loss (gain) on:          
  accrued pension liability   0.5     (3.6 )     (4.2 )   5.7  
  post-employment benefit obligations   0.5     (4.1 )     (6.5 )   6.9  
  Finance costs   24.1     17.0       57.0     53.3  
  Loss on disposal of property, plant and equipment   0.6     0.2       1.0     0.2  
  Interest on pension and other post-employment benefit obligations   3.6     4.0       10.7     11.9  
  Other income   –     –       (47.9 )   (50.0 )
  Accretion of governmental loans and environmental liabilities   8.7     3.3       12.1     12.4  
  Unrealized foreign exchange (gain) loss on government loan facilities   (0.7 )   (3.2 )     (12.7 )   5.1  
  Increase (decrease) in fair value of IPO and LETL Warrant liabilities   0.9     (11.9 )     8.7     (46.4 )
  Increase (decrease) in fair value of earnout liability   0.1     (3.0 )     0.1     (6.1 )
  Increase (decrease) in fair value of share-based compensation liability   0.4     (11.4 )     0.4     (21.7 )
  Impairment loss   –     503.4       –     503.4  
  Other   3.4     2.8       2.0     15.1  
    ($
74.8
) ($58.8 )   ($
306.0
) ($134.4 )
  Net change in non-cash operating working capital   134.0     (58.2 )     267.2     37.1  
  Environmental liabilities paid   –     (0.3 )     (0.1 )   (0.8 )
  Insurance proceeds for operating expenses   19.4     –       25.9     35.0  
  Cash generated by (used in) operating activities $
78.6
  ($117.3 )   ($
13.0
) ($63.1 )
  Investing activities          
  Acquisition of property, plant and equipment ($
67.7
) ($52.4 )   ($
117.1
) ($276.8 )
  Insurance proceeds for property damage   25.6     –       25.6     15.0  
  Cash used in investing activities ($
42.1
) ($52.4 )   ($
91.5
) ($261.8 )
  Financing activities          
  Bank indebtedness (repaid) advanced, net ($
71.6
) $83.4     ($
171.0
) $99.4  
  Restricted cash   –     –       0.1     –  
  Governmental loans received   129.4     –       384.5     16.3  
  Governmental loans transaction costs   (0.1 )   –       (0.1 )   –  
  Repayment of governmental loans   (0.1 )   (1.4 )     (0.2 )   (13.9 )
  Interest paid   (5.1 )   (0.6 )     (35.0 )   (25.1 )
  Dividends paid   –     –       –     (14.8 )
  Other   (0.9 )   9.8       (2.7 )   11.3  
  Cash generated by financing activities $
51.6
  $91.2     $
175.6
  $73.2  
  Effect of exchange rate changes on cash $
1.7
  $0.5     $
3.8
  ($10.7 )
  Cash          
  Increase (decrease) in cash   89.8     (78.0 )     74.9     (262.4 )
  Opening balance   62.6     82.5       77.5     266.9  
  Ending balance $
152.4
  $4.5     $
152.4
  $4.5  


Algoma Steel Group Inc.
Reconciliation of Net Loss to Adjusted EBITDA
  Three months ended September 30,   Nine months ended September 30,
millions of dollars 2026 2025   2026 2025
Net loss ($
129.6
)
  ($485.1)     ($
385.0
)
  ($620.2)  
Depreciation of property, plant and equipment and amortization of intangible assets   17.7     43.4       74.1     116.6  
Finance costs   24.1     17.0       57.0     53.3  
Interest on pension and other post-employment benefit obligations   3.6     4.0       10.7     11.9  
Income tax (recovery) expense   (1.7
)
    (145.7)       0.3     (209.0)  
Foreign exchange loss (gain)   10.0     (14.3)       (23.1
)
    18.1  
Finance income   (2.3
)
    (1.1)       (3.4
)
    (6.4)  
Inventory adjustments(depreciation on property, plant & equipment in inventory)   (2.8
)
    2.9       (11.0
)
    4.4  
Carbon tax   (3.2
)
    9.5       10.3     23.4  
Change in fair value of financial instruments (i)   1.4     (26.3)       9.2     (74.2)  
Share-based compensation   3.5     5.2       10.5     12.5  
Legal settlements, fees and legacy contracts   12.3     –       23.5     –  
Capacity utilization   53.1     –       198.0     –  
Impairment loss   –     503.4       –     503.4  
Adjusted EBITDA (ii) ($
13.9
)
  ($87.1)     ($
28.9
)
  ($166.2)  
Net Loss Margin   (52.0
%)
    (92.6%)       (47.3
%)
    (38.0%)  
Net Loss / ton ($
896.7
)
  ($1,157.3)     ($
700.4
)
  ($455.7)  
Adjusted EBITDA Margin (iii)   (5.6
%)
    (16.6%)       (3.6
%)
    (10.2%)  
Adjusted EBITDA / ton ($
96.2
)
  ($207.8)     ($
52.6
)
  ($122.1)  
           
(i) Financial instruments at fair value are comprised of IPO and LETL Warrant liabilities, earnout liability, share-based payment compensation liability and derivatives.
(ii) See “Non-GAAP Financial Measures” in this Press Release for information regarding the limitations of using Adjusted EBITDA.
(iii) Adjusted EBITDA Margin is Adjusted EBITDA as a percentage of revenue.