
– Revenue of $9.4 billion, up 7.3% from year-ago quarter; growth in all four segments
– Net earnings of $708 million, diluted EPS of $2.48
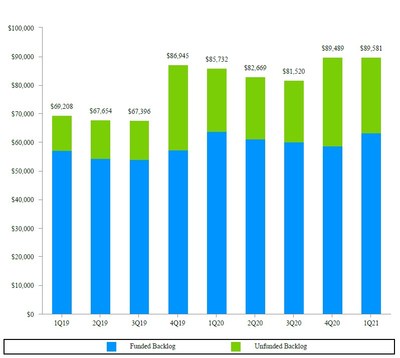
– Record-high backlog of $89.6 billion, up 4.5% from year-ago quarter
PR Newswire
RESTON, Va., April 28, 2021 /PRNewswire/ — General Dynamics (NYSE: GD) today reported first-quarter 2021 net earnings of $708 million on revenue of $9.4 billion. Diluted earnings per share (EPS) were $2.48.
Revenue grew year-over-year by 7.3% company-wide, with growth in all four segments and growth exceeding 10% in the Aerospace and Marine Systems segments. Company-wide operating margin for the quarter was 10%. Orders remained strong, with backlog up 4.5% from the year-ago quarter to a record $89.6 billion.
“Continued recovery from the pandemic coupled with our focus on operating performance yielded a strong quarter, with year-over-year earnings growth driven by increased revenue across all of our four business segments,” said Phebe N. Novakovic, chairman and chief executive officer. “Our improved cash outlook enabled us to continue investing in future growth while returning capital to shareholders.”
Cash
Net cash provided by operating activities in the quarter totaled $3 million, compared with a use of cash of $666 million in the year-ago quarter. Free cash flow from operations, defined as net cash provided by operating activities less capital expenditures, was a net outflow of $131 million. During the quarter, the company invested $134 million in capital expenditures, paid $315 million in dividends, and repurchased $744 million in shares at an average price of $161.38 per share, ending the quarter with $1.8 billion in cash and equivalents on hand.
Backlog
Total backlog at the end of first-quarter 2021 was $89.6 billion, up 4.5% from the year-ago quarter. Estimated potential contract value, representing management’s estimate of value in unfunded indefinite delivery, indefinite quantity (IDIQ) contracts and unexercised options, was $41.8 billion. Total estimated contract value, the sum of all backlog components, was $131.4 billion at the end of the quarter.
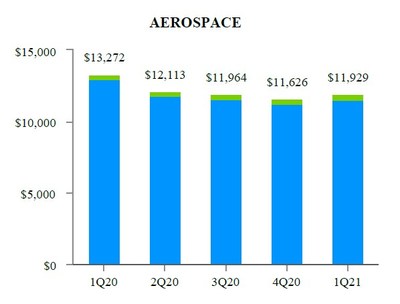
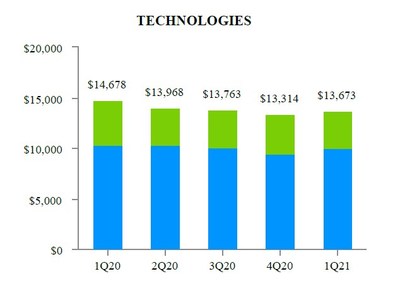
Order activity was strong across the company, with a total book-to-bill ratio (orders divided by revenue) of 1-to-1 for the quarter. Orders rose faster than revenue in the Aerospace and Technologies segments, with book-to-bill ratios for the quarter of 1.3-to-1 and 1.1-to1, respectively.
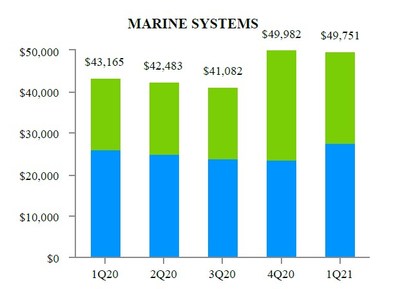
Significant awards in the quarter included a contract with a maximum potential value of $12.6 billion among multiple awardees to provide information technology (IT) and technical support services to intelligence agencies under the Solutions for the Information Technology Enterprise (SITE) III program; $1.9 billion from the U.S. Navy for the construction of a 10th Block V Virginia-class submarine; a contract with a maximum potential value of $805 million among multiple awardees to provide ship modernization services to the Navy; $295 million from the U.S. Army for various munitions and ordnance; $225 million from the Army for inventory management and support services for its Stryker vehicle fleet; $200 million from the Federal Emergency Management Agency (FEMA) to provide Coronavirus (COVID-19)-related contact-center operations and support services; $190 million in contracts from the Army for technical support and upgrades for Abrams main battle tanks; and $175 million from the Army for computing and communications equipment under the Common Hardware Systems-5 (CHS-5) program.
About General Dynamics
Headquartered in Reston, Virginia, General Dynamics is a global aerospace and defense company that offers a broad portfolio of products and services in business aviation; ship construction and repair; land combat vehicles, weapons systems and munitions; and technology products and services. General Dynamics employs more than 100,000 people worldwide and generated $37.9 billion in revenue in 2020. More information is available at www.gd.com.
Certain statements made in this press release, including any statements as to future results of operations and financial projections, may constitute “forward-looking statements” within the meaning of the Private Securities Litigation Reform Act of 1995, as amended. Forward-looking statements are based on management’s expectations, estimates, projections and assumptions. These statements are not guarantees of future performance and involve risks and uncertainties that are difficult to predict. Therefore, actual future results and trends may differ materially from what is forecast in forward-looking statements due to a variety of factors. Additional information regarding these factors is contained in the company’s filings with the Securities and Exchange Commission, including, without limitation, its Annual Report on Form 10-K, its Quarterly Reports on Form 10-Q and its Current Reports on Form 8-K. All forward-looking statements speak only as of the date they were made. The company does not undertake any obligation to update or publicly release any revisions to forward-looking statements to reflect events, circumstances or changes in expectations after the date of this press release.
WEBCAST INFORMATION: General Dynamics will webcast its first-quarter 2021 financial results conference call at 9 a.m. EDT on Wednesday, April 28, 2021. The webcast will be a listen-only audio event available at
www.gd.com
.
An on-demand replay of the webcast will be available one hour after the end of the call and end on May 5, 2021. To hear a recording of the conference call by telephone, please call 877-344-7529 (international: 412-317-0088); passcode 10153889. Charts furnished to investors and securities analysts in connection with General Dynamics‘ announcement of its financial results are available at www.gd.com.
|
|
|||||||||||||||||||||||
|
|
|||||||||||||||||||||||
|
|
|||||||||||||||||||||||
|
|
|
||||||||||||||||||||||
|
|
March 29, 2020 |
|
|
||||||||||||||||||||
|
Revenue |
|
|
$ |
8,749 |
$ |
640 |
7.3 |
% |
|||||||||||||||
|
Operating costs and expenses |
|
(7,815) |
(636) |
||||||||||||||||||||
|
Operating earnings |
|
934 |
4 |
0.4 |
% |
||||||||||||||||||
|
Other, net |
|
21 |
9 |
||||||||||||||||||||
|
Interest, net |
|
(107) |
(16) |
||||||||||||||||||||
|
Earnings before income tax |
|
848 |
(3) |
(0.4) |
% |
||||||||||||||||||
|
Provision for income tax, net |
|
(142) |
5 |
||||||||||||||||||||
|
Net earnings |
|
|
$ |
706 |
$ |
2 |
0.3 |
% |
|||||||||||||||
|
Earnings per share—basic |
|
|
$ |
2.45 |
$ |
0.04 |
1.6 |
% |
|||||||||||||||
|
Basic weighted average shares outstanding |
|
288.6 |
|||||||||||||||||||||
|
Earnings per share—diluted |
|
|
$ |
2.43 |
$ |
0.05 |
2.1 |
% |
|||||||||||||||
|
Diluted weighted average shares outstanding |
|
289.9 |
|||||||||||||||||||||
|
|
|||||||||||||||||||||||
|
|
|||||||||||||||||||||||
|
|
|||||||||||||||||||||||
|
|
|
||||||||||||||||||||||
|
|
March 29, 2020 |
|
|
||||||||||||||||||||
|
|
|||||||||||||||||||||||
|
Aerospace |
|
|
$ |
1,691 |
$ |
196 |
11.6 |
% |
|||||||||||||||
|
Marine Systems |
|
2,246 |
237 |
10.6 |
% |
||||||||||||||||||
|
Combat Systems |
|
1,708 |
112 |
6.6 |
% |
||||||||||||||||||
|
Technologies |
|
3,104 |
95 |
3.1 |
% |
||||||||||||||||||
|
|
|
|
$ |
8,749 |
$ |
640 |
7.3 |
% |
|||||||||||||||
|
|
|||||||||||||||||||||||
|
Aerospace |
|
|
$ |
240 |
$ |
(20) |
(8.3) |
% |
|||||||||||||||
|
Marine Systems |
|
184 |
16 |
8.7 |
% |
||||||||||||||||||
|
Combat Systems |
|
223 |
21 |
9.4 |
% |
||||||||||||||||||
|
Technologies |
|
298 |
8 |
2.7 |
% |
||||||||||||||||||
|
Corporate |
|
(11) |
(21) |
(190.9) |
% |
||||||||||||||||||
|
|
|
|
$ |
934 |
$ |
4 |
0.4 |
% |
|||||||||||||||
|
|
|||||||||||||||||||||||
|
Aerospace |
|
|
14.2 |
% |
|||||||||||||||||||
|
Marine Systems |
|
|
8.2 |
% |
|||||||||||||||||||
|
Combat Systems |
|
|
13.1 |
% |
|||||||||||||||||||
|
Technologies |
|
|
9.6 |
% |
|||||||||||||||||||
|
|
|
|
10.7 |
% |
|||||||||||||||||||
|
|
|||||||||||
|
|
|||||||||||
|
|
|||||||||||
|
|
|||||||||||
|
|
December 31, 2020 |
||||||||||
|
|
|||||||||||
|
|
|||||||||||
|
Cash and equivalents |
|
|
$ |
2,824 |
|||||||
|
Accounts receivable |
|
3,161 |
|||||||||
|
Unbilled receivables |
|
8,024 |
|||||||||
|
Inventories |
|
5,745 |
|||||||||
|
Other current assets |
|
1,789 |
|||||||||
|
Total current assets |
|
21,543 |
|||||||||
|
|
|||||||||||
|
Property, plant and equipment, net |
|
5,100 |
|||||||||
|
Intangible assets, net |
|
2,117 |
|||||||||
|
Goodwill |
|
20,053 |
|||||||||
|
Other assets |
|
2,495 |
|||||||||
|
Total noncurrent assets |
|
29,765 |
|||||||||
|
|
|
|
$ |
51,308 |
|||||||
|
|
|||||||||||
|
|
|||||||||||
|
Short-term debt and current portion of long-term debt |
|
|
$ |
3,003 |
|||||||
|
Accounts payable |
|
2,952 |
|||||||||
|
Customer advances and deposits |
|
6,276 |
|||||||||
|
Other current liabilities |
|
3,733 |
|||||||||
|
Total current liabilities |
|
15,964 |
|||||||||
|
|
|||||||||||
|
Long-term debt |
|
9,995 |
|||||||||
|
Other liabilities |
|
9,688 |
|||||||||
|
Total noncurrent liabilities |
|
19,683 |
|||||||||
|
|
|||||||||||
|
Common stock |
|
482 |
|||||||||
|
Surplus |
|
3,124 |
|||||||||
|
Retained earnings |
|
33,498 |
|||||||||
|
Treasury stock |
|
(17,893) |
|||||||||
|
Accumulated other comprehensive loss |
|
(3,550) |
|||||||||
|
Total shareholders’ equity |
|
15,661 |
|||||||||
|
|
|
|
$ |
51,308 |
|||||||
|
|
|||||||||||
|
|
|||||||||||
|
|
|||||||||||
|
|
|||||||||||
|
|
March 29, 2020 |
||||||||||
|
|
|||||||||||
|
Net earnings |
|
|
$ |
706 |
|||||||
|
Adjustments to reconcile net earnings to net cash from operating activities: |
|||||||||||
|
Depreciation of property, plant and equipment |
|
122 |
|||||||||
|
Amortization of intangible and finance lease right-of-use assets |
|
90 |
|||||||||
|
Equity-based compensation expense |
|
30 |
|||||||||
|
Deferred income tax benefit |
|
(28) |
|||||||||
|
(Increase) decrease in assets, net of effects of business acquisitions: |
|||||||||||
|
Accounts receivable |
|
(33) |
|||||||||
|
Unbilled receivables |
|
(78) |
|||||||||
|
Inventories |
|
(546) |
|||||||||
|
Increase (decrease) in liabilities, net of effects of business acquisitions: |
|||||||||||
|
Accounts payable |
|
(375) |
|||||||||
|
Customer advances and deposits |
|
(373) |
|||||||||
|
Other, net |
|
(181) |
|||||||||
|
Net cash provided (used) by operating activities |
|
(666) |
|||||||||
|
|
|||||||||||
|
Capital expenditures |
|
(185) |
|||||||||
|
Other, net |
|
8 |
|||||||||
|
Net cash used by investing activities |
|
(177) |
|||||||||
|
|
|||||||||||
|
Purchases of common stock |
|
(449) |
|||||||||
|
Dividends paid |
|
(295) |
|||||||||
|
Proceeds from fixed-rate notes |
|
3,960 |
|||||||||
|
Proceeds from commercial paper, net |
|
2,271 |
|||||||||
|
Other, net |
|
(202) |
|||||||||
|
Net cash (used) provided by financing activities |
|
5,285 |
|||||||||
|
Net cash used by discontinued operations |
|
(14) |
|||||||||
|
|
|
4,428 |
|||||||||
|
|
|
902 |
|||||||||
|
|
|
|
$ |
5,330 |
|||||||
|
|
|||||||||||||||||||||||
|
|
|||||||||||||||||||||||
|
|
|||||||||||||||||||||||
|
|
|||||||||||||||||||||||
|
|
December 31, 2020 |
||||||||||||||||||||||
|
Debt-to-equity (a) |
|
|
83.0 |
% |
|||||||||||||||||||
|
Debt-to-capital (b) |
|
|
45.4 |
% |
|||||||||||||||||||
|
Book value per share (c) |
|
|
$ |
54.67 |
|||||||||||||||||||
|
Shares outstanding |
|
286,477,836 |
|||||||||||||||||||||
|
|
|||||||||||||||||||||||
|
|
2020 |
||||||||||||||||||||||
|
Income tax payments, net |
|
|
$ |
43 |
|||||||||||||||||||
|
Company-sponsored research and development (d) |
|
|
$ |
78 |
|||||||||||||||||||
|
Return on sales (e) |
|
|
8.1 |
% |
|||||||||||||||||||
|
|
|||||||||||||||||||||||
|
|
|||||||||||||||||||||||
|
|
2020 |
||||||||||||||||||||||
|
|
|||||||||||||||||||||||
|
Net earnings |
|
|
$ |
706 |
|||||||||||||||||||
|
Interest, net |
|
107 |
|||||||||||||||||||||
|
Provision for income tax, net |
|
142 |
|||||||||||||||||||||
|
Depreciation of property, plant and equipment |
|
122 |
|||||||||||||||||||||
|
Amortization of intangible and finance lease right-of-use assets |
|
90 |
|||||||||||||||||||||
|
Earnings before interest, taxes, depreciation and amortization (f) |
|
|
$ |
1,167 |
|||||||||||||||||||
|
|
|||||||||||||||||||||||
|
Net cash provided (used) by operating activities |
|
|
$ |
(666) |
|||||||||||||||||||
|
Capital expenditures |
|
(185) |
|||||||||||||||||||||
|
Free cash flow from operations (g) |
|
|
$ |
(851) |
|||||||||||||||||||
|
(a) |
Debt-to-equity ratio is calculated as total debt divided by total equity as of the end of the period. |
|
(b) |
Debt-to-capital ratio is calculated as total debt divided by the sum of total debt plus total equity as of the end of the period. |
|
(c) |
Book value per share is calculated as total equity divided by total outstanding shares as of the end of the period. |
|
(d) |
Includes independent research and development and Aerospace product-development costs. |
|
(e) |
Return on sales is calculated as net earnings divided by revenue. |
|
(f) |
We believe earnings before interest, taxes, depreciation and amortization (EBITDA) is a useful measure for investors because it provides another measure of our profitability and our ability to service our debt. We calculate EBITDA by adding back interest, taxes, depreciation and amortization to net earnings. The most directly comparable GAAP measure to EBITDA is net earnings. |
|
(g) |
We believe free cash flow from operations is a useful measure for investors because it portrays our ability to generate cash from our businesses for purposes such as repaying maturing debt, funding business acquisitions, repurchasing our common stock and paying dividends. We use free cash flow from operations to assess the quality of our earnings and as a key performance measure in evaluating management. The most directly comparable GAAP measure to free cash flow from operations is net cash provided (used) by operating activities. |
|
|
||||||||||||||||||||||||||||||||
|
|
||||||||||||||||||||||||||||||||
|
|
||||||||||||||||||||||||||||||||
|
|
|
|
|
|
||||||||||||||||||||||||||||
|
|
||||||||||||||||||||||||||||||||
|
Aerospace |
$ |
11,545 |
$ |
384 |
$ |
11,929 |
$ |
2,312 |
$ |
14,241 |
||||||||||||||||||||||
|
Marine Systems |
27,676 |
22,075 |
49,751 |
2,815 |
52,566 |
|||||||||||||||||||||||||||
|
Combat Systems |
14,085 |
143 |
14,228 |
9,120 |
23,348 |
|||||||||||||||||||||||||||
|
Technologies |
10,003 |
3,670 |
13,673 |
27,530 |
41,203 |
|||||||||||||||||||||||||||
|
|
|
|
|
|
|
|
|
|
|
|
||||||||||||||||||||||
|
|
||||||||||||||||||||||||||||||||
|
Aerospace |
$ |
11,308 |
$ |
318 |
$ |
11,626 |
$ |
2,800 |
$ |
14,426 |
||||||||||||||||||||||
|
Marine Systems |
23,646 |
26,336 |
49,982 |
4,876 |
54,858 |
|||||||||||||||||||||||||||
|
Combat Systems |
14,341 |
226 |
14,567 |
9,774 |
24,341 |
|||||||||||||||||||||||||||
|
Technologies |
9,488 |
3,826 |
13,314 |
27,727 |
41,041 |
|||||||||||||||||||||||||||
|
|
|
|
|
|
|
|
|
|
|
|
||||||||||||||||||||||
|
|
||||||||||||||||||||||||||||||||
|
Aerospace |
$ |
12,998 |
$ |
274 |
$ |
13,272 |
$ |
2,837 |
$ |
16,109 |
||||||||||||||||||||||
|
Marine Systems |
26,112 |
17,053 |
43,165 |
4,460 |
47,625 |
|||||||||||||||||||||||||||
|
Combat Systems |
14,373 |
244 |
14,617 |
4,253 |
18,870 |
|||||||||||||||||||||||||||
|
Technologies |
10,322 |
4,356 |
14,678 |
26,595 |
41,273 |
|||||||||||||||||||||||||||
|
|
|
|
|
|
|
|
|
|
|
|
||||||||||||||||||||||
|
* |
The estimated potential contract value includes work awarded on unfunded indefinite delivery, indefinite quantity (IDIQ) contracts and unexercised options associated with existing firm contracts, including options and other agreements with existing customers to purchase new aircraft and aircraft services. We recognize options in backlog when the customer exercises the option and establishes a firm order. For IDIQ contracts, we evaluate the amount of funding we expect to receive and include this amount in our estimated potential contract value. The actual amount of funding received in the future may be higher or lower than our estimate of potential contract value. |
|
|
|
|
|
|
https://mma.prnewswire.com/media/1497917/Exhibit_F_1.jpg
|
|
|
|
|
|
https://mma.prnewswire.com/media/1497918/EXHIBIT_F_2_Aerospace.jpg
https://mma.prnewswire.com/media/1497920/EXHIBIT_F_2_Marine_Systems.jpg
https://mma.prnewswire.com/media/1497923/EXHIBIT_F_2_Combat_Systems.jpg
https://mma.prnewswire.com/media/1497925/EXHIBIT_F_2_Technologies.jpg

https://mma.prnewswire.com/media/1497926/EXHIBIT_F_2_Segment_Key.jpg
|
|
|
|
|
|
We received the following significant contract awards during the first quarter of 2021:
Marine Systems:
- $1.9 billion from the U.S. Navy for the construction of a tenth submarine in Block V of the Virginia-class submarine program.
- $75 from the Navy for Advanced Nuclear Plant Studies (ANPS) in support of the Columbia-class submarine program.
- $30 from the Navy for maintenance and modernization work on the USS Princeton, a Ticonderoga-class guided-missile cruiser.
Combat Systems:
- $295 from the U.S. Army for various munitions and ordnance.
- $225 from the Army for inventory management and support services for the Stryker fleet.
- $120 from the Army to provide systems technical support for Abrams main battle tanks.
- $110 to produce M3 amphibious bridging vehicles for an international customer.
- $70 from the Army to upgrade Abrams tanks to the M1A2 System Enhancement Package Version 3 (SEPv3) configuration.
Technologies:
- A contract to provide information technology (IT) and technical support services to the Defense Intelligence Agency (DIA) and the National Geospatial-Intelligence Agency (NGA) under the Solutions for the Information Technology Enterprise (SITE) III program. The program has a maximum potential value of $12.6 billion among multiple awardees.
- An IDIQ contract to provide ship, carrier, submarine and service craft modernization for the Navy. The program has a maximum potential value of $805 among multiple awardees.
- $45 from the U.S. Coast Guard to provide sustainment support for the Rescue 21 program. The contract has a maximum potential value of $235.
- $200 from the Federal Emergency Management Agency (FEMA) to provide Coronavirus (COVID-19)-related contact-center operations and support services.
- $175 from the Army for computing and communications equipment under the Common Hardware Systems-5 (CHS-5) program.
- $135 to provide enterprise IT, communications and mission command support services to U.S. Army Europe.
- $130 to provide turnkey training and simulation services for the Army’s Aviation Center of Excellence in Fort Rucker, Alabama.
- $120 from the U.S. Air Force for the Battlefield Information Collection and Exploitation System (BICES) program to provide intelligence information sharing capabilities for the Department of Defense (DoD).
- A contract to provide software development and IT support services to the U.S. Patent and Trademark Office. The contract has a maximum potential value of $95.
- $70 from the Army for the production of Prophet enhanced ground-based signals intelligence and electronic warfare systems.
|
|
||||||||||||||||||||||||||
|
|
||||||||||||||||||||||||||
|
|
||||||||||||||||||||||||||
|
|
2020 |
|||||||||||||||||||||||||
|
|
||||||||||||||||||||||||||
|
Large-cabin aircraft |
|
20 |
||||||||||||||||||||||||
|
Mid-cabin aircraft |
|
3 |
||||||||||||||||||||||||
|
|
|
23 |
||||||||||||||||||||||||
|
|
||||||||||||||||||||||||||
|
Orders* |
|
|
$ |
1,856 |
||||||||||||||||||||||
|
Revenue |
|
1,691 |
||||||||||||||||||||||||
|
|
|
1.10x |
||||||||||||||||||||||||
|
* |
Does not include customer defaults, liquidated damages, cancellations, foreign exchange fluctuations and other backlog adjustments. |

 View original content to download multimedia:http://www.prnewswire.com/news-releases/general-dynamics-reports-first-quarter-2021-financial-results-301278335.html
SOURCE General Dynamics
