CORRECTING and REPLACING Tiendas 3B 4Q24 & FY2024 Earnings Release
MEXICO CITY–(BUSINESS WIRE)–
Please replace the release dated April 9, 2025 with the following corrected version due to changes in the 4Q24 and 2024 “Building Lease Payments” bullet points and the corresponding footnotes.
This press release features multimedia. View the full release here: https://www.businesswire.com/news/home/20250409391149/en/

Spagetti: Median Sales per Store Vintage (1) Ps. million | Median 12-Month Period (2) Sales per Store (3) in Real Terms (4)
The updated release reads:
TIENDAS 3B 4Q24 & FY2024 EARNINGS RELEASE
BBB Foods Inc. (“Tiendas 3B” or the “Company”)(NYSE: TBBB), a leading grocery hard discounter in Mexico, announced today its consolidated results for the fourth quarter of 2024 (4Q24) and for the year ended December 31, 2024. The figures presented in this release are expressed in nominal Mexican Pesos (Ps.) and are prepared in accordance with International Financial Reporting Standards (“IFRS”), unless otherwise stated.
HIGHLIGHTS
FOURTH QUARTER 2024
-
Opened 138 net new stores during the quarter, reaching 2,772 stores as of December 31, 2024.
-
Ps. 16,347 million total revenue for 4Q24.
-
32.7% revenue growth compared to 4Q23.
-
Same Store Sales growth 11.8% compared to 4Q23.
-
EBITDAreachedPs. 845 million, an increase of 51.1%.
FULL-YEAR 2024
-
Opened 484 net new stores during 2024.
-
Ps. 57,439 million total revenue for the full year.
-
30.3% total revenue growth compared to 2023.
-
Same Store Sales growth of 13.4% compared to 2023.
-
EBITDAreachedPs. 2,847 million, an increase of 51.2%.
-
Negative working capital was Ps. 2,633 million.
-
Cash flow from operations increased by 16.6%.
MESSAGE FROM THE CHAIRMAN AND CEO
Dear Investors,
We delivered rapid growth and strong performance in 2024. We opened 484 new stores, bringing our total to 2,772. Same Store Sales increased by 13.4%, once again outperforming the market. Our success is driven by the increasing value we provide our customers, disciplined execution, and the efficient scaling of our store openings.
Our financial performance was strong. Total revenue reached Ps. 57,439 million, up 30.3% vs. 2023. EBITDA grew 51.2% to Ps. 2,847 million, supported by higher sales, improved operations, and disciplined cost control.
In Q4, we continued to deliver. We opened 138 new stores, with Same Store Sales growing 11.8%, well above ANTAD’s 2.6%. Quarterly revenue rose 32.7% to Ps. 16,347 million, while EBITDA increased 51.1% to Ps. 845 million. These results reflect our ability to scale rapidly and efficiently.
In Q1 2025, we celebrated two milestones: the one-year anniversary of our IPO and the successful completion of a secondary offering. I want to thank our investors for their continued confidence in our ability to deliver long-term profitable growth.
Ours is a business that is robust and that thrives in uncertain times. As we move into 2025, our focus is clear: expand our footprint, enhance our capabilities, and continue improving the exceptional value we provide to the millions of Mexican families who shop with us every day.
Thank you for your continued support.
K. Anthony Hatoum, Chairman and Chief Executive Officer
|
FINANCIAL RESULTS
4Q24 CONSOLIDATED RESULTS
(In Ps. Million, except percentages)
|
| |
|
Please see the explanation at the end of this release on how EBITDA, a non-IFRS financial measure, is calculated, and for other relevant definitions.
|
|
|
|
|
|
|
|
|
|
4Q24
|
As % of
Revenue
|
4Q23
|
As % of
Revenue
|
Growth (%)
|
Variation (Bps)
|
|
Total Revenue
|
Ps. 16,347
|
100.0%
|
Ps. 12,316
|
100.0%
|
32.7%
|
n.m.
|
|
Gross Profit
|
Ps. 2,698
|
16.5%
|
Ps. 2,011
|
16.3%
|
34.2%
|
18 bps
|
|
Sales Expenses
|
(Ps. 1,913)
|
11.7%
|
(Ps. 1,392)
|
11.3%
|
37.4%
|
40 bps
|
|
Administrative Expenses
|
(Ps. 561)
|
3.4%
|
(Ps. 354)
|
2.9%
|
58.4%
|
56 bps
|
|
Other (Expense) Income – Net
|
Ps. 54
|
0.3%
|
(Ps. 37)
|
0.3%
|
246.3%
|
3 bps
|
|
EBITDA
|
Ps. 845
|
5.2%
|
Ps. 559
|
4.5%
|
51.1%
|
63 bps
|
TOTAL REVENUE
Total revenue for 4Q24 was Ps. 16,347 million, an increase of 32.7% compared to 4Q23. Most of this growth was driven by sales from stores that have been operating for more than one year, and, to a lesser extent, the incremental sales from 484 net new stores opened in 2024.
GROSS PROFIT AND GROSS PROFIT MARGIN
Gross profit for 4Q24 was Ps. 2,698 million, an increase of 34.2% compared to 4Q23. This increase was driven by sales growth and an improvement in our gross margin of 18 bps to 16.5% mainly due to improved supplier terms as we leveraged our increased scale.
EXPENSES
Sales expenses primarily reflect the cost of operating our stores, including wages and energy. In 4Q24, sales expenses reached Ps. 1,913 million, a 37.4% increase compared to 4Q23. This growth was driven by (i) an expanded store base requiring additional headcount, (ii) wage inflation, (iii) non-recurring, non-cash accounting recognitions for the full year that impact this quarter, principally related to depreciation and asset write-offs (see Additional Disclosure on page 5). As a percentage of total revenue, sales expenses increased from 11.3% in 4Q23 to 11.7% in 4Q24, an increase of 40 bps.
Administrative expenses refer to expenses not directly related to operating our stores, such as headquarters and regional office expenses. For 4Q24, administrative expenses totaled Ps. 561 million, a 58.4% increase compared to 4Q23. This increase reflects (i) the hiring of additional headquarter personnel to support growth, (ii) public company readiness, reporting and compliance costs, (iii) an expansion of regional operations as we opened new regions, and (iv) non-recurring expenses related to the preparation for the February 2025 follow-on offering. As a percentage of revenue, administrative expenses increased from 2.9% in 4Q23 to 3.4% in 4Q24, an expansion of 56 bps.
Other (expense) income – net, which includes, among other items, revenues (expenses) from non-operative activities such as asset disposals, cost reimbursements, and insurance proceeds, amounted to a net income of Ps. 54 million in 4Q24, compared to a net expense of Ps. 37 million in 4Q23. This variation was driven mainly by incremental income from balance sheet clean-ups such as reversals of inactive liabilities and cancellation of historical cash overages, which were partially offset by write-offs of certain legacy line items and non-recurring legal and compliance expenses. As a percentage of total revenue, other (expense) income – net remained flat at 0.3% in 4Q24 compared to 4Q23.
EBITDA AND EBITDA MARGIN
For 4Q24, EBITDA reached Ps. 845 million, an increase of 51.1% compared to 4Q23. This increase was mainly driven by higher sales as a result of our net store openings and Same Store Sales growth, improvements in gross profit margin and increases in other income resulting from balance sheet clean-ups. These effects were partially offset by higher administrative expenses. The EBITDA margin for 4Q24 increased by 63 bps to reach 5.2%.
Please see the last section of this release on how we calculate EBITDA and EBITDA Margin, which are non-IFRS financial measures.
ADDITIONAL DISCLOSURES
To allow investors to better assess our performance, the Company is providing the following supplementary information:
- Non-recurring cash expenses: The Company incurred non-recurring cash expenses of Ps. 69 million in the quarter, primarily related to the preparation for the follow-on offering and other corporate, legal, compliance, and regulatory matters.
- Non-recurring non-cash income (expenses): The Company recorded a net non-cash benefit of Ps. 91 million in 4Q24 following the annual audit review. This figure reflects the reversal of Ps. 123 million of certain legacy balance sheet items, offset in part by Ps. 33 million in depreciation expenses related to the write-off of fixed assets.
-
The combined impact of these items was to increase reported EBITDA by Ps. 56 million (Ps. 123 million less Ps. 69 million).
- Rights-of-use asset depreciation (IFRS 16): The Company recognized a one-time, non-cash depreciation of Ps. 93 million related to prior under-recognition of depreciation for IFRS 16 right-of-use assets.
- Building lease payments: The Company leases its stores and distribution centers. In accordance with IFRS 16, the Company’s lease expenses are capitalized, and not considered operating expenses. Tiendas 3B’s capitalized lease costs payments for buildings were Ps. 378 million1 in 4Q24, compared to Ps. 293 million in 4Q23.
1 The figures for Building lease payments for 4Q24 (Ps. 378 million) have been revised from those in the original release (Ps. 403 million) issued on April 9, 2025 due to a data entry error.
FINANCIAL COSTS AND NET LOSS
Financial income totaled Ps. 46 million in 4Q24, up from Ps. 6 million in 4Q23. The increase was primarily driven by interest earned on the cash proceeds from the initial public offering (“IPO”), most of which were invested in short-term, dollar denominated instruments.
Financial costs were Ps. 333 million for 4Q24, a 35.8% decrease compared to 4Q23. This decline was primarily driven by the repayment of our promissory notes and convertible notes with the proceeds from our IPO in February 2024. The reduction was partially offset by higher interest expenses on lease liabilities, reflecting the expansion of our store base and distribution center network during 2024.
The Company recorded a foreign exchange gain of Ps. 105 million in 4Q24, driven by the Mexican peso depreciation against the U.S. dollar, which positively impacted our U.S. dollar-denominated cash position held from the IPO.
Income tax expenses reached Ps. 120 million in the 4Q24 compared to Ps. 14 million in 4Q23.
As a result, our net loss for the 4Q24 was Ps. 24 million, compared to a net loss of Ps. 97 million for the 4Q23.
FULL YEAR 2024 CONSOLIDATED RESULTS
(In Ps. Million, except percentages)
|
|
2024
|
As % of
Revenue
|
2023
|
As % of
Revenue
|
Growth (%)
|
Variation (Bps)
|
|
Total Revenue
|
Ps. 57,439
|
100.0%
|
Ps. 44,078
|
100.0%
|
30.3%
|
n.m.
|
|
Gross Profit
|
Ps. 9,376
|
16.3%
|
Ps. 7,040
|
16.0%
|
33.2%
|
35 bps
|
|
Sales Expenses
|
(Ps. 6,122)
|
10.7%
|
(Ps. 4,823)
|
10.9%
|
26.9%
|
-28 bps
|
|
Administrative Expenses
|
(Ps. 1,987)
|
3.5%
|
(Ps. 1,387)
|
3.1%
|
43.3%
|
31 bps
|
|
Other (Expense) Income – Net
|
Ps. 61
|
0.1%
|
(Ps. 36)
|
0.1%
|
268.6%
|
2 bps
|
|
EBITDA
|
Ps. 2,847
|
5.0%
|
Ps. 1,883
|
4.3%
|
51.2%
|
68 bps
|
Please see the explanation at the end of this release on how EBITDA, a non-IFRS financial measure, is calculated, and for other relevant definitions.
TOTAL REVENUE
Total revenue for 2024 was Ps. 57,439 million, an increase of 30.3% compared to 2023. In 2024, sales growth was primarily driven by a 25.8% increase in the number of transactions, which increased to 671 million from 533 million in 2023. The average ticket also increased, from Ps. 82.4 to Ps. 85.4, a gain of 3.6%. Most of this growth was driven by sales from stores that have been operating for more than one year, and to a lesser extent, the incremental sales from net new stores opened during the year.
GROSS PROFIT AND GROSS PROFIT MARGIN
Gross profit for 2024 was Ps. 9,376 million, an increase of 33.2% compared to 2023. This was driven by sales growth and an increase in our gross margin of 35 bps to 16.3%, mainly due to improved supplier terms as we leveraged our growing scale.
EXPENSES
In 2024, sales expenses reached Ps. 6,122 million, a 26.9% increase compared to 2023. This increase in sales expenses was driven by a higher number of stores, as headcount expanded to operate new stores, plus the impact of wage inflation on labor costs. As a percentage of total revenue, sales expenses decreased from 10.9% in 2023 to 10.7% in 2024, a decrease of 28 bps.
For 2024, administrative expenses reached Ps. 1,987 million, a 43.3% increase compared to 2023. This increase was due to (i) the hiring of additional headquarter personnel to support growth, (ii) public company readiness, reporting and compliance costs, (iii) expansion of regional operations as we opened new regions, and (iv) non-recurring expenses, mainly related to the IPO. As a percentage of total revenue, administrative expenses increased from 3.15% in 2023 to 3.46% in 2024, for an increase of 31 bps.
Other (expense) income – net amounted to Ps. 61 million in income for 2024, compared to an expense of Ps. 36 million in 2023. The year-over-year improvement primarily reflects non-recurring gains from balance sheet clean-ups such as reversals of inactive liabilities and cancellation of historical cash overages, which were partially offset by write-offs of legacy line items and non-recurring legal and compliance expenses. In contrast, the 2023 figure included impairment charges related to stores affected by Hurricane Otis in Acapulco. As a percentage of total revenue, other (expense) income – net remained flat at 0.1% in 2024 compared to 2023.
EBITDA AND EBITDA MARGIN
For 2024, EBITDA reached Ps. 2,847 million, an increase of 51.2% compared to 2023. The EBITDA Margin moved from 4.3% in 2023 to 5.0% in 2024, an expansion of 68 bps. This increase was attributable to higher sales as a result of our net store openings and Same Store Sales growth, as well as improvements in gross profit margin, sells expenses, which were offset by the impact of non-recurring factors discussed below and the increase in expenses mainly attributed to our transition to becoming a public company.
Please see the last section of this release on how we calculate EBITDA and EBITDA Margin, which are non-IFRS financial measures.
2024 ADDITIONAL DISCLOSURES
To allow our investors to better assess our performance, we are providing the following information:
- Non-recurring cash expenses: The Company incurred non-recurring cash expenses totaling Ps. 139 million, primarily related to the IPO and to the preparation for the follow-on offering and other corporate, legal, compliance and regulatory matters.
- Non-recurring non-cash income (expenses): The Company recorded a net non-cash benefit of Ps. 91 million in 2024, booked in 4Q24, following the annual audit review. This figure reflects the reversal of Ps. 123 million in certain legacy balance sheet items, offset by Ps. 33 million in depreciation expenses related to the write-off of fixed assets.
-
The combined impact of these items was to decrease reported EBITDA by Ps. 16 million (Ps. 123 million less Ps. 139 million).
- Rights-of-use asset depreciation (IFRS 16): As disclosed in the 4Q24 section above, the Company recognized a one-time, non-cash depreciation of Ps. 93 million related to prior under-recognition of depreciation for IFRS 16 right-of-use asset.
- Building lease payments: The Company leases its stores and distribution centers. In accordance with IFRS 16, the Company’s lease expenses are capitalized, and not considered operating expenses. Tiendas 3B’s capitalized lease costs payments for buildings were Ps. 1,389 million2 in 2024, compared to Ps. 1,072 in 2023.
2 The figures for Building lease payments for 2024 (Ps. 1,389 million) have been revised from those in the original release (Ps. 1,542 million) issued on April 9, 2025 due to a data entry error.
FINANCIAL COSTS AND NET PROFIT
Financial income totaled Ps. 156 million in 2024, an increase of 498% compared to 2023. The increase was primarily driven by interest earned on the cash proceeds from the IPO.
Financial costs were Ps. 1,257 million in 2024, a decrease of 17.7% compared to 2023. This variance was primarily attributable to two key factors: (i) the increase in interest expenses related to lease liabilities; and (ii) a reduction in financing costs associated with our promissory notes and convertible notes, which had been outstanding in 2023 but were fully repaid in February 2024 using proceeds from our IPO.
In 2024, we recorded a foreign exchange gain of Ps. 490 million, primarily driven by our USD-denominated investments.
Our income tax expenses reached Ps. 383 million in 2024 compared to Ps. 205 million in 2023.
As a result, our net profit for 2024 was Ps. 334 million, compared to a net loss of Ps. 306 million for 2023.
BALANCE SHEET AND LIQUIDITY
As of December 31, 2024, the Company reported cash and cash equivalents of Ps. 1,447 million an increase from Ps. 1,220 million as of December 31, 2023. In addition, as of December 2024, the Company held Ps. 3,059 million in U.S. dollar-denominated short-term bank deposits. The Company considers an exchange rate as of December 31, 2024 of Ps. 20.268.
CASH FLOW STATEMENT FOR 2024
(In Ps. Million, except percentages)
|
|
2024
|
2023
|
Growth (%)
|
|
Net cash flows provided by operating activities
|
Ps. 3,749
|
Ps. 3,140
|
19.4%
|
|
Net cash flows used in investing activities
|
(Ps. 4,907)
|
(Ps. 1,779)
|
175.9%
|
|
Net cash flows provided by (used in) financing activities
|
Ps. 1,288
|
(Ps. 1,096)
|
n.m.
|
|
Net (decrease) increase in cash and cash equivalents
|
Ps. 129
|
Ps. 266
|
-51.3%
|
Our business model continues to generate a significant amount of cash from our negative working capital cycle due to our increasing sales, and high inventory turnover relative to payment terms. This robust cash flow has enabled us to fund internally our growth initiatives, including the expansion of new stores and distribution centers.
The information provided below offers a view of our cash flow activities in 2024:
Net cash flows provided by operating activities increased to Ps. 3,749 million for 2024 from Ps. 3,140 million for 2023. Our net working capital continues to be driven by a favorable ratio of Inventory Days to Payable Days.
Net cash flows used in investing activities were Ps. 4,907 million for 2024, compared to Ps. 1,779 million in 2023. This is primarily due to the investment of IPO proceeds in short-term bank investments, and to a lesser extent to increases in property, plant & equipment (PP&E) in connection with the opening of new stores and two distribution centers.
Net cash flows provided by financing activities were Ps. 1,288 million for 2024, compared to Ps. Ps. 1,096 million used for 2023, and consisted mainly of IPO proceeds, which were offset by the repayment of the promissory and convertible notes.
KEY ANNUAL OPERATING METRICS
|
|
2024
|
2023
|
Variation (%)
|
|
Number of Stores Opened
|
484
|
396
|
22.2%
|
|
Number Distribution Centers
|
16
|
14
|
14.3%
|
|
Same Store Sales Growth (%)
|
13.4%
|
17.6%
|
n.m.
|
|
Private label Sales Products (% of Sales of Merchandise)
|
53.6%
|
46.5%
|
710 bps
|
|
Average Ticket Size (1)
|
Ps. 85.4
|
Ps. 82.4
|
3.6%
|
|
Transaction Number (2)
|
26,821
|
25,635
|
4.6%
|
| (1) |
|
We calculate “Average Ticket Size” by dividing revenue from Sales of Merchandise by the total number of transactions.
|
| (2) |
|
Number of transactions is derived from stores that have been operating for 5+ years.
|
During 2024, we opened 484 stores compared to the 396 stores we opened in 2023. In 4Q24 we opened 138 stores. To support the incremental number of stores, in 2024 we opened two additional distribution centers.
Same Store Sales grew by 11.8% for 4Q24, compared to 14.9% for 4Q23. For the year 2024, Same Store Sales increased by 13.4%, compared to 17.6% for 2023. The slowdown in Same Store Sales growth reflects in good part the decrease in inflation from 2023 to 2024.
Our private label offering continues to gain as a share of sales of merchandise. The share of revenue from private labels increased from 46.5% in 2023 to 53.6% in 2024.
STORE PERFORMANCE BY VINTAGE
Median Sales per Store Vintage (1)
Ps. million | Median 12-Month Period (2) Sales per Store (3) in Real Terms (4)
Source: Company Information. INEGI
| (1) |
|
12-month period since opening, excludes month 1. (i.e., period 1 is from month 2 through month 13 since opening.)
|
| (2) |
|
Median 12-month period sales of all stores in the corresponding vintage (excludes first month to “normalize” dates in which stores are operational since opening). Closed stores are excluded from medial calculation.
|
| (3) |
|
All figures in real Mexican pesos terms as of December 31, 2022, adjusted for inflation using Mexican National Consumer Price (índice Nacional de Precios al Consumidor), as provided by the Mexican Statistic and National Geography Institute (Instituto de Estadística y Geografía), and as published by Banco de México.
|
| (4) |
|
Number of stores opened in the corresponding vintage that remain open as of December 2022.
|
Median Sales per Store Vintage (1)
Ps. million | Median 12-Month Period (2) Sales per Store (3) in Real Terms (4) | Excluding Temporary Closures in Acapulco
Source: Company Information. INEGI
| (1) |
|
“Sales Ramp-up Evolution by Vintage” measures, for stores of the same vintage, the median of such stores’ revenue from sales of merchandise during 12-month periods since the start of the operation. When calculating this measure, we exclude the first calendar month of a store’s operations to account for stores that are not open for the entire month, as well as stores that have been permanently closed. Considers stores opened in the corresponding vintage that remains open as of December 2024.
|
| (2) |
|
12-month period since opening, excludes month 1.
|
| (3) |
|
Median 12-month period sales of all stores in the corresponding vintage (excludes first month to “normalize” dates in which stores are operational since opening). Closed stores are excluded from median calculation, as well as stores in Acapulco that suffered temporary closures due to affectations by Hurricane Otis and Hurricane John.
|
| (4) |
|
All figures in real Ps. terms as of December 31, 2024, adjusted for inflation using Mexican National Consumer Price (Índice Nacional de Precios al Consumidor), as provided by the Mexican Statistic and National Geography Institute (Instituto de Estadística y Geografía), and as published by Banco de México.
|
Our Sales per Store curves have shown a consistent upward trend across store vintages from 2005 to 2023. The data, adjusted for inflation, reflects growing sales maturity over time, with earlier vintages becoming more productive over time. The charts above demonstrate our disciplined approach to store expansion, with new stores not negatively impacting the sales of older stores (indeed, on the contrary).
2025 GUIDANCE
|
|
Range
|
|
Same Store Sales Growth (%)
|
11% – 14%
|
|
Revenue Growth (%)
|
26% – 29%
|
|
Number of New Stores
|
500 – 550
|
For 2025, the Company plans to open between 500 and 550 stores during the year. We expect Same Store Sales growth between 11% and 14% and total revenue is forecast to grow by 26% to 29%. This guidance is predicated on the prevailing consensus regarding the outlook for the Mexican economy and is subject to change, particularly if Mexico’s economic performance deviates from current expectations.
Disclaimer
The foregoing 2025 guidance reflects management’s current assumptions regarding numerous evolving factors that are difficult to accurately predict, including those discussed in the “Risk Factors” section set forth in the Company’s Registration Statement on Form F-1 filed with the U.S. Securities and Exchange Commission (the “SEC”) and the Company’s Annual Report on Form 20-F to be filed with the SEC.
A reconciliation of the forward-looking non-IFRS measure, specifically the 2024 EBITDA Margin guidance, to the relevant forward-looking IFRS measure is not being provided, as the Company does not currently have sufficient data to accurately estimate the variables and individual adjustments for such guidance and reconciliation. Due to this uncertainty, the Company cannot reconcile projected EBITDA Margin to projected net profit/loss without unreasonable effort.
The 2025 guidance constitutes forward-looking statements. For more information, see “Forward-Looking Statements” in this release.
Non-IFRS Measures and Other Calculations
For the convenience of investors, this release presents certain non-IFRS financial measures, which are not calculated in accordance with IFRS (“non-IFRS financial measures”). A non-IFRS financial measure is generally defined as one that purports to measure financial performance but excludes or includes amounts that would not be so excluded or included in the most comparable IFRS financial measure. Non-IFRS financial measures do not have standardized meanings and may not be directly comparable to similarly titled measures reported by other companies. These non-IFRS financial measures are used by our management for decision-making purposes and to assess our financial and operating performance, generate future operating plans and make strategic decisions regarding the allocation of capital. The non-IFRS financial measures presented herein have limitations as analytical tools, and you should not consider them in isolation or as substitutes for analysis of our results of operations presented in accordance with IFRS. Additionally, our calculations of non-IFRS financial measures may be different from the calculations used by other companies, including our competitors, and therefore, our non-IFRS financial measures may not be comparable to those of other companies.
We calculate “EBITDA”, a non-IFRS measure, as net profit (loss) for the period, plus income tax expense, financial costs, net, and total depreciation and amortization.
We calculate “EBITDA Margin”, a non-IFRS measure, for a period by dividing EBITDA for the corresponding period by total revenue for such period.
Same Store Sales: We measure “Same Store Sales” using revenue from sales of merchandise at stores that were operational for at least the full preceding 12 months for the periods under consideration. Stores that were temporarily closed (for one month or more) or permanently closed during the relevant measurement periods are excluded from this metric. Same Store Sales growth is calculated by comparing the Same Store Sales of stores that were opened and remained open throughout the relevant measurement period.
Lease Costs: Consistent with lease accounting required under IFRS 16, total depreciation and amortization includes the depreciation expense of right-of-use-asset corresponding to long-term leases, which is a non-cash expense. Such amounts, together with the interest expense on lease liabilities, is a proxy for but not equal to the Company’s actual cash expenditure incurred in connection with its leased properties.
Sales per Store: We define our “Sales per Store” as the average of the revenue from sales of merchandise achieved by our stores that were open for the full year in consideration. When calculating this measure, we exclude stores that were temporarily closed (for one month or more) or permanently closed during the period in consideration. This measure assists our management’s understanding of how store performance has evolved across different vintages. Sales per Store also serves as a benchmark to measure the performance of new stores and is useful to set growth and expansion targets.
Inventory Days: We calculate “Inventory Days” to be the average of beginning and end of period inventory balance, divided by cost of sales for the period and multiplied by the number of days during the period. Inventory Days measures the average number of days we keep inventory on hand before selling the product. This operating metric allows us to track our inventory management policies and observe how quickly we are able to rotate inventory, which is key to our cash conversion cycle.
Payable Days: We calculate “Payable Days” to be the sum of the average of beginning and end of period balance of suppliers and of accounts payable and accrued expenses, divided by cost of sales for the period and multiplied by the number of days during the period. Payable Days measures the average number of days that it takes us to pay suppliers after receiving goods or services. This metric allows us to track the terms of payment policies with suppliers and our ability to finance our operations through agreements with our suppliers.
CONFERENCE CALL DETAILS
Tiendas 3B will host a call to discuss the fourth quarter and full year 2024 results on April 10th, 2025, at 12:00 p.m. Eastern Time (10:00 a.m. Mexico City time). A webinar of the call will be accessible at: https://us02web.zoom.us/webinar/register/WN_MErmKczJTCiO9xXPTksV5w#/registration
To join via telephone, please dial one of the domestic or international numbers listed below:
Mexico
+52 558 659 6002
+52 554 161 4288
+52 554 169 6926
United States
+1 312 626 6799 (Chicago)
+1 346 248 7799 (Houston)
+1 646 558 8656 (New York)
Other international numbers available: https://us02web.zoom.us/u/knEOJCJkC
The webinar ID is 856 8379 3599
An audio replay from the conference call will be available on the Tiendas 3B website https://www.investorstiendas3b.com after the call.
FORWARD-LOOKING STATEMENTS
This release includes forward-looking statements within the meaning of Section 27A of the U.S. Securities Act of 1933, as amended, and Section 21E of the U.S. Securities Exchange Act of 1934, as amended. We base these forward-looking statements on our current beliefs, expectations and projections about future events and trends affecting our business and our market. Many important factors could cause our actual results to differ substantially from those anticipated in our forward-looking statements. Forward-looking statements are not guarantees of future performance. Forward-looking statements speak only as of the date they are made, and we undertake no obligation to update publicly or to revise any forward-looking statements. New risks and uncertainties emerge from time to time, and it is not possible for us to predict all risks and uncertainties that could have an impact on the forward-looking statements contained in this release. The words “believe,” “may,” “should,” “aim,” “estimate,” “continue,” “anticipate,” “intend,” “will,” “expect” and similar words are intended to identify forward-looking statements. Forward looking statements include information concerning our possible or assumed future results of operations, business strategies, capital expenditures, financing plans, competitive position, industry environment, potential growth opportunities, the effects of future regulation and the effects of competition. Please refer to our annual report on Form 20-F for the year ended December 31, 2024 filed with the U.S. Securities Exchange Commission (the “SEC”), as well as any subsequent filings made by us with the SEC, each of which is available on the SEC’s website (www.sec.gov), for a more extensive discussion of the risks and other factors that may impact any forward-looking statements in this release. Considering these limitations, you should not make any investment decision in reliance on forward-looking statements contained in this release.
ABOUT TIENDAS 3B
BBB Foods Inc. (“Tiendas 3B”), a proudly Mexican company, is a pioneer and leader of the grocery hard discount model in Mexico and one of the fastest growing retailers in the country as measured by its sales and store growth rates. The 3B name, which references “Bueno, Bonito y Barato” – a Mexican saying which translates to “Good, Nice and Affordable” – summarizes Tiendas 3B’s mission of offering irresistible value to budget savvy consumers through great quality products at bargain prices. By delivering value to the Mexican consumer, we believe we contribute to the economic well-being of Mexican families. In a landmark achievement, Tiendas 3B was listed on the New York Stock Exchange in February 2024 under the ticker symbol “TBBB”.
For more information, please visit: https://www.investorstiendas3b.com/
|
FINANCIAL STATEMENTS
Consolidated Income Statement
(Unaudited)
For the three months ended December 31, 2024, and December 31, 2023
(In thousands of Mexican pesos)
|
|
|
|
|
For the Three Months Ended December 31,
|
|
|
2024
|
2023
|
% Change
|
|
|
|
|
|
|
Revenue From Sales of Merchandise
|
Ps. 16,318,342
|
Ps. 12,293,230
|
32.7%
|
|
Sales of Recyclables
|
28,276
|
22,374
|
26.4%
|
|
Total Revenue
|
16,346,618
|
12,315,604
|
32.7%
|
|
Cost of Sales
|
(13,648,700)
|
(10,304,939)
|
32.4%
|
|
Gross Profit
|
Ps. 2,697,918
|
Ps. 2,010,665
|
34.2%
|
|
Gross Profit Margin
|
16.5%
|
16.3%
|
|
|
Sales Expenses
|
(1,913,108)
|
(1,391,882)
|
37.4%
|
|
Administrative Expenses
|
(560,524)
|
(353,785)
|
58.4%
|
|
Other Income – Net
|
53,979
|
(36,905)
|
n.m.
|
|
Operating Profit
|
Ps. 278,265
|
Ps. 228,093
|
22.0%
|
|
Operating Profit Margin
|
1.7%
|
1.9%
|
|
|
Financial Income
|
46,362
|
5,559
|
734.0%
|
|
Financial Costs
|
(333,199)
|
(519,239)
|
(35.8%)
|
|
Exchange Rate Fluctuation
|
105,093
|
202,348
|
n.m.
|
|
Financial Cost – Net
|
(181,744)
|
(311,332)
|
(41.6%)
|
|
Loss Before Income Tax
|
96,521
|
(83,239)
|
n.m.
|
|
Income Tax Expense
|
(120,091)
|
(13,745)
|
773.7%
|
|
Net Loss (Profit) for the Period
|
(Ps. 23,570)
|
(Ps. 96,984)
|
(75.7%)
|
|
Net Profit Margin
|
0.1%
|
0.8%
|
|
|
|
|
|
|
|
Basic Earnings (Loss) per Share
|
(0.21)
|
(8.08)
|
|
|
Diluted Earnings (Loss) per Share
|
(0.16)
|
(8.08)
|
|
|
|
|
|
|
|
Weighted Average Common Shares Outstanding:
|
|
|
|
|
Basic
|
112,200,752
|
12,000,000
|
|
|
Diluted
|
142,593,711
|
12,000,000
|
|
|
|
|
|
|
|
EBITDA Reconciliation
|
|
|
|
|
|
|
|
|
|
Net Loss (Profit) for the Period
|
(Ps.23,570)
|
(Ps. 96,984)
|
(75.7%)
|
|
Net Profit Margin
|
0.1%
|
0.8%
|
|
|
Income Tax Expense
|
(120,091)
|
(13,745)
|
773.7%
|
|
Financial Cost – Net
|
(181,744)
|
(311,332)
|
(41.6%)
|
|
D&A
|
566,513
|
331,049
|
71.1%
|
|
EBITDA
|
Ps. 844,778
|
Ps. 559,142
|
51.1%
|
|
EBITDA Margin
|
5.2%
|
4.5%
|
|
|
|
|
|
|
|
|
|
|
|
|
FINANCIAL STATEMENTS
Consolidated Income Statement
(Unaudited)
For the years ended December 31, 2024, and December 31, 2023
(In thousands of Mexican pesos)
|
|
|
|
|
For the Years Ended December 31,
|
|
|
2024
|
2023
|
% Change
|
|
|
|
|
|
|
Revenue From Sales of Merchandise
|
Ps. 57,333,327
|
Ps. 43,987,803
|
30.3%
|
|
Sales of Recyclables
|
105,692
|
90,656
|
16.6%
|
|
Total Revenue
|
57,439,019
|
44,078,459
|
30.3%
|
|
Cost of Sales
|
(48,062,913)
|
(37,038,542)
|
29.8%
|
|
Gross Profit
|
Ps. 9,376,106
|
Ps. 7,039,917
|
33.2%
|
|
Gross Profit Margin
|
16.3%
|
16.0%
|
|
|
Sales Expenses
|
(6,121,566)
|
(4,822,912)
|
26.9%
|
|
Administrative Expenses
|
(1,987,075)
|
(1,386,929)
|
43.3%
|
|
Other Income – Net
|
61,044
|
(36,213)
|
n.m.
|
|
Operating Profit
|
Ps. 1,328,509
|
Ps. 793,863
|
67.3%
|
|
Operating Profit Margin
|
2.3%
|
1.8%
|
|
|
Financial Income
|
155,863
|
26,069
|
497.9%
|
|
Financial Costs
|
(1,257,254)
|
(1,527,107)
|
(17.7%)
|
|
Exchange Rate Fluctuation
|
490,428
|
606,270
|
(19.1%)
|
|
Financial Cost – Net
|
(610,963)
|
(894,768)
|
(31.7%)
|
|
Loss Before Income Tax
|
717,546
|
(100,905)
|
n.m.
|
|
Income Tax Expense
|
(383,124)
|
(205,248)
|
86.7%
|
|
Net Profit (Loss) for the Period
|
Ps. 334,422
|
(Ps. 306,153)
|
n.m.
|
|
Net Profit Margin
|
0.6%
|
0.8%
|
|
|
|
|
|
|
|
Basic Earnings (Loss) per Share
|
3.06
|
(25.51)
|
|
|
Diluted Earnings (Loss) per Share
|
2.40
|
(25.51)
|
|
|
|
|
|
|
|
Weighted Average Common Shares Outstanding:
|
|
|
|
|
Basic
|
109,203,573
|
12,000,000
|
|
|
Diluted
|
139,606,695
|
12,000,000
|
|
|
|
|
|
|
|
EBITDA Reconciliation
|
|
|
|
|
|
|
|
|
|
Net Profit (Loss) for the Period
|
Ps. 334,422
|
(Ps. 306,153)
|
n.m.
|
|
Net Profit Margin
|
0.6%
|
0.8%
|
|
|
Income Tax Expense
|
(383,124)
|
(205,248)
|
86.7%
|
|
Financial Cost – Net
|
(610,963)
|
(894,768)
|
(31.7%)
|
|
D&A
|
1,518,599
|
1,089,095
|
39.4%
|
|
EBITDA
|
Ps. 2,847,108
|
Ps. 1,882,958
|
51.2%
|
|
EBITDA Margin
|
5.0%
|
4.3%
|
|
|
Consolidated Balance Sheet
(Unaudited)
As of December 31, 2024, and December 31, 2023
(In thousands of Mexican pesos)
|
|
|
|
|
As of December 31,
|
|
|
2024
|
2023
|
|
Current assets:
|
|
|
|
Cash and cash equivalents
|
Ps. 1,447,166
|
Ps. 1,220,471
|
|
Short-term bank deposits
|
3,058,691
|
–
|
|
Sundry debtors
|
95,058
|
11,020
|
|
VAT and other taxes receivable
|
843,926
|
731,186
|
|
Advanced payments
|
70,925
|
72,998
|
|
Inventories
|
3,038,373
|
2,357,485
|
|
Total Current Assets
|
Ps. 8,554,139
|
Ps. 4,393,160
|
|
Non-Current Assets:
|
|
|
|
Guarantee deposits
|
72,652
|
33,174
|
|
VAT receivable
|
174,936
|
–
|
|
Property, furniture, equipment, and lease-hold improvements – Net
|
6,455,625
|
4,606,300
|
|
Right-of-use assets – Net
|
7,028,346
|
5,520,596
|
|
Intangible assets – Net
|
6,790
|
6,771
|
|
Deferred income tax
|
484,325
|
403,801
|
|
Total Non-Current Assets
|
Ps. 14,222,674
|
Ps. 10,570,642
|
|
Total Assets
|
Ps. 22,776,813
|
Ps. 14,963,802
|
|
|
|
|
|
Current liabilities:
|
|
|
|
Suppliers
|
Ps. 8,835,875
|
Ps. 7,126,089
|
|
Accounts payable and accrued expenses
|
341,828
|
322,959
|
|
Income tax payable
|
74,642
|
2,326
|
|
Bonus payable to related parties
|
58,702
|
78,430
|
|
Short-term debt
|
926,765
|
744,137
|
|
Lease liabilities
|
750,127
|
537,515
|
|
Employees’ statutory profit sharing payable
|
199,477
|
140,485
|
|
Total Current Liabilities
|
Ps. 11,187,416
|
Ps. 8,951,941
|
|
Non-Current Liabilities:
|
|
|
|
Debt with related parties
|
–
|
4,340,452
|
|
Long-term debt
|
106,693
|
577,318
|
|
Lease liabilities
|
7,415,363
|
5,706,707
|
|
Employee benefits
|
32,559
|
22,232
|
|
Total Non-Current Liabilities
|
Ps. 7,554,615
|
Ps. 10,646,709
|
|
Total Liabilities
|
Ps. 18,742,031
|
Ps. 19,598,650
|
|
|
|
|
|
Stockholders’ equity:
|
|
|
|
Capital stock
|
8,283,347
|
471,282
|
|
Reserve for share-based payments
|
1,374,844
|
851,701
|
|
Cumulative losses
|
(5,623,409)
|
(5,957,831)
|
|
Total Stockholders’ Equity
|
Ps. 4,034,782
|
(Ps. 4,634,848)
|
|
Total Liabilities and Stockholders’ Equity
|
Ps. 22,776,813
|
Ps. 14,963,802
|
|
Cash Flow Statement
(Unaudited)
For the years ended December 31, 2024, and December 31, 2023
(In thousands of Mexican pesos)
|
|
|
|
|
For the Years Ended December 31,
|
|
|
2024
|
2023
|
|
|
|
|
|
Profit (loss) before income tax
|
Ps. 717,547
|
(Ps.100,905)
|
|
Adjustments for:
|
|
|
|
Depreciation of property, furniture, equipment, and lease-hold improvements
|
719,987
|
488,409
|
|
Depreciation of right-of-use assets
|
796,182
|
598,031
|
|
Amortization of intangible assets
|
2,430
|
2,655
|
|
Impairment of property and equipment
|
–
|
42,422
|
|
Employee benefits
|
10,327
|
3,873
|
|
Interest payable on Promissory Notes and Convertible Notes
|
82,588
|
619,779
|
|
Interest expense on lease liabilities
|
1,072,774
|
762,872
|
|
Interest on debt and bonus payable, and amortization of issuance costs
|
36,390
|
29,747
|
|
Loss related to modification and remeasurement of Promissory Notes
|
–
|
84,236
|
|
Other financial income
|
(155,863)
|
(26,069)
|
|
Interests and commissions from credit lines
|
65,503
|
–
|
|
Loss on termination of lease agreements
|
1,573
|
–
|
|
Exchange rate fluctuation
|
(490,428)
|
(610,703)
|
|
Share-based payment expense
|
523,143
|
384,566
|
|
|
|
|
|
Increase in inventories
|
(680,887)
|
(425,880)
|
|
Increase in other current assets and guarantee deposits
|
(418,647)
|
(138,013)
|
|
Increase in suppliers (including supplier finance arrangements)
|
1,709,786
|
1,735,897
|
|
Increase in other current liabilities
|
165,090
|
78,963
|
|
(Decrease) increase on bonus payable to related parties
|
(20,648)
|
(8,564)
|
|
Income taxes paid
|
(388,310)
|
(380,967)
|
|
Net cash flows provided by operating activities
|
Ps. 3,748,537
|
Ps. 3,140,349
|
|
|
|
|
|
Purchase of property, furniture, equipment, and lease-hold improvements
|
(2,435,695)
|
(1,798,019)
|
|
Sale of property and equipment
|
1,877
|
3,776
|
|
Additions to intangible assets
|
(2,449)
|
(1,185)
|
|
Short-term bank deposits
|
(2,614,080)
|
–
|
|
Interest received from settlement of derivative financial
|
7,980
|
–
|
|
Interest received on short-term investments
|
135,071
|
16,639
|
|
Net cash flows used in investing activities
|
(Ps. 4,907,296)
|
(Ps. 1,778,789)
|
|
|
|
|
|
Payments made on supplier finance arrangements – Net of commissions received
|
(3,251,211)
|
(2,074,890)
|
|
Finance obtained through supplier finance arrangements
|
3,498,928
|
2,195,833
|
|
Proceeds from credit lines
|
–
|
99,618
|
|
Payment of principal of Promissory Notes
|
(1,974,787)
|
–
|
|
Payment of accrued interests of Promissory Notes
|
(2,955,495)
|
–
|
|
Payment of debt
|
(208,679)
|
(104,769)
|
|
Interest payment on debt
|
(94,734)
|
(25,224)
|
|
Proceeds from initial public offering, net of underwriting fees
|
7,841,837
|
–
|
|
Initial Public Offering Capitalized costs
|
(23,269)
|
–
|
|
Principal payment on lease liabilities
|
(471,703)
|
–
|
|
Interest payments on lease liabilities
|
(1,072,774)
|
762,872
|
|
Net cash flows provided by (used in) financing activities
|
Ps. 1,288,113
|
(Ps. 1,095,692)
|
|
|
|
|
|
Net increase (decrease) in cash and cash equivalents
|
129,354
|
265,868
|
|
Effect of foreign exchange movements on cash balances
|
97,341
|
(30,373)
|
|
Cash and cash equivalents at beginning of period
|
1,220,471
|
984,976
|
|
Cash and cash equivalent at end of period
|
Ps. 1,447,166
|
Ps. 1,220,471
|

View source version on businesswire.com: https://www.businesswire.com/news/home/20250409391149/en/
INVESTOR RELATIONS CONTACT
Andrés Villasis
[email protected]
KEYWORDS: Latin America North America United States Mexico Central America
INDUSTRY KEYWORDS: Retail Supermarket Food/Beverage
MEDIA:
| Photo |
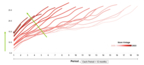 |
| Spagetti: Median Sales per Store Vintage (1) Ps. million | Median 12-Month Period (2) Sales per Store (3) in Real Terms (4) |
| Photo |
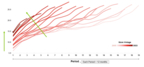 |
| Spagetti Ex Acapulco: Median Sales per Store Vintage (1) Ps. million | Median 12-Month Period (2) Sales per Store (3) in Real Terms (4) | Excluding Temporary Closures in Acapulco |
| Logo |
 |
|