Ra Medical Systems Reports 2020 Third Quarter Financial Results

Ra Medical Systems Reports 2020 Third Quarter Financial Results

Conference call begins at 4:30 p.m. Eastern time today

CARLSBAD, Calif.–(BUSINESS WIRE)–Ra Medical Systems, Inc. (NYSE: RMED), a medical device company focusing on commercializing excimer laser systems to treat vascular and dermatological diseases, reports financial results for the three and nine months ended September 30, 2020 and provides a business update.

Recent Operational Highlights

  • Twelve subjects enrolled in the Company’s atherectomy pivotal clinical trial, for a total of 13 subjects enrolled to date
  • Positive test results support the path to extend the shelf life of future DABRA catheters
  • Next-generation DABRA catheter projects are advancing on or ahead of schedule with prototypes available for in vitro testing
  • The quality improvement program initiated in late 2019 is substantially complete

“I’m encouraged by the progress we’ve made during the third quarter and in recent weeks, in particular with patient enrollment in our atherectomy pivotal trial and with improvements and enhancements to the DABRA catheter,” said Will McGuire, Ra Medical Systems CEO. “We are executing well on our engineering, clinical and quality initiatives, and I am confident that we will deliver on our milestones.”

Third Quarter Financial Highlights

Net revenue for the third quarter of 2020 was $0.9 million, which consisted of product sales of $0.2 million and service and other revenue of $0.7 million. This compares with net revenue of $1.9 million for the third quarter of 2019, which consisted of product sales of $1.1 million and service and other revenue of $0.8 million.

Net revenue from the vascular segment for the third quarter of 2020 was $0.1 million, compared with $0.2 million for the third quarter of 2019. Net revenue from the dermatology segment was $0.8 million for the third quarter of 2020, compared with $1.7 million for the third quarter of 2019.

Total cost of revenue for the third quarter of 2020 was $1.4 million, compared with $2.4 million for the third quarter of 2019.

Selling, general and administrative expenses for the third quarter of 2020 were $4.9 million, which included $0.8 million in stock-based compensation, compared with $15.9 million for the third quarter of 2019, which included $6.6 million in stock-based compensation. Research and development expenses for the third quarter of 2020 were $2.3 million, compared with $1.2 million for the third quarter of 2019. Research and development expenses for the third quarters of 2020 and 2019 included $0.1 million and $0.3 million of stock-based compensation, respectively.

The net loss for the third quarter of 2020 was $7.8 million, or $0.13 per share, compared with a net loss for the third quarter of 2019 of $17.4 million, or $1.30 per share.

Adjusted EBITDA for the third quarter of 2020 was negative $6.2 million, compared with negative $9.9 million for the third quarter of 2019. Adjusted EBITDA is a non-GAAP measure presented as net loss before depreciation and amortization expense, interest income, interest expense, income taxes and stock-based compensation. For additional information regarding the non-GAAP financial measures discussed in this news release, please see “Non-GAAP Reconciliations” below.

Ra Medical reported cash and cash equivalents of $33.6 million as of September 30, 2020.

Nine Month Financial Highlights

Net revenue for the first nine months of 2020 was $3.2 million, which consisted of product sales of $0.9 million and service and other revenue of $2.3 million. This compares with net revenue of $5.8 million for the first nine months of 2019, which consisted of product sales of $3.3 million and service and other revenue of $2.5 million.

Net revenue from the vascular segment was $0.3 million for the first nine months of 2020, compared with $1.1 million for the first nine months of 2019. Net revenue from the dermatology segment was $2.9 million for the first nine months of 2020, compared with $4.7 million for the first nine months of 2019.

Total cost of revenue for the first nine months of 2020 was $4.2 million, compared with $7.1 million for the first nine months of 2019.

Selling, general and administrative expenses for the first nine months of 2020 were $19.1 million, which included $2.5 million in stock-based compensation, compared with $42.9 million for the first nine months of 2019, which included $19.3 million in stock-based compensation. Research and development expenses for the first nine months of 2020 were $5.6 million, which included $0.3 million in stock-based compensation, compared with $3.7 million for the first nine months of 2019, which included $1.4 million in stock-based compensation.

The net loss for the first nine months of 2020 was $25.6 million, or $0.79 per share, compared with a net loss for the first nine months of 2019 of $47.2 million, or $3.63 per share.

Adjusted EBITDA for the first nine months of 2020 was negative $20.8 million, compared with negative $24.4 million for the first nine months of 2019.

Conference Call and Webcast

Ra Medical will hold a conference call and audio webcast to discuss this announcement and answer questions at 4:30 p.m. Eastern time today. The conference call dial-in numbers are 866-777-2509 for domestic callers and 412-317-5413 for international callers, and the passcode is 10149446. A live webcast of the call will be available on the Investor Relations section of www.ramed.com.

A recording of the call will be available for 48 hours beginning approximately two hours after the completion of the call by dialing 877-344-7529 for domestic callers, 855-669-9658 for Canadian callers or 412-317-0088 for international callers. Please use the passcode 10149446. A webcast replay will be available on the Investor Relations section of www.ramed.com for 30 days, beginning approximately two hours after the completion of the call.

Non-GAAP Financial Measures

Ra Medical has presented certain financial information in accordance with U.S. GAAP and also on a non-GAAP basis for the three- and nine-month periods ended September 30, 2020 and September 30, 2019. EBITDA and Adjusted EBITDA are performance measures that provide supplemental information management believes is useful to analysts and investors to evaluate Ra Medical’s ongoing results of operations, when considered alongside other GAAP measures. These measures are intended to aid investors in better understanding Ra Medical’s current financial performance and prospects for the future as seen through management. Management uses non-GAAP measures to compare the company’s performance relative to forecasts and strategic plans and to benchmark the company’s performance externally against competitors. Management believes that these non-GAAP financial measures facilitate comparisons with Ra Medical’s historical results and with the results of peer companies who present similar measures (although other companies may define non-GAAP measures differently than we define them, even when similar terms are used to identify such measures). Non-GAAP information is not prepared under a comprehensive set of accounting rules and should only be used to supplement an understanding of the company’s operating results as reported under U.S. GAAP. Ra Medical encourages investors to carefully consider its results under GAAP, as well as its supplemental non-GAAP information and the reconciliation between these presentations, to more fully understand its business. Reconciliations between GAAP and non-GAAP operating results are presented in the accompanying tables of this release.

Investors are encouraged to review the related GAAP financial measures and the reconciliation of these non-GAAP financial measures to their most directly comparable GAAP financial measures, and not to rely on any single financial measure to evaluate our business. Ra Medical defines EBITDA as our GAAP net loss as adjusted to exclude depreciation and amortization, interest income, interest expense and income tax expense. Ra Medical defines Adjusted EBITDA as our GAAP net loss as adjusted to exclude depreciation and amortization, interest income, interest expense, income tax expense and stock-based compensation.

About Ra Medical Systems

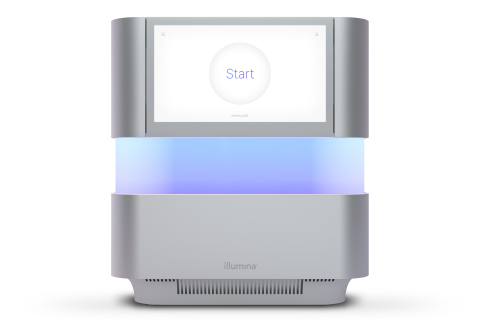
Ra Medical Systems commercializes excimer lasers and catheters for the treatment of vascular and dermatological diseases. In May 2017, the DABRA excimer laser system received FDA 510(k) clearance in the U.S. for crossing chronic total occlusions, or CTOs, in patients with symptomatic infrainguinal lower extremity vascular disease with an intended use for ablating a channel in occlusive peripheral vascular disease. The Pharos excimer laser system is FDA-cleared and is used as a tool in the treatment of psoriasis, vitiligo, atopic dermatitis and leukoderma. DABRA and Pharos are both based on Ra Medical’s core excimer laser technology platform and deploy similar mechanisms of action. Ra Medical manufactures DABRA and Pharos excimer lasers and catheters in a 32,000-square-foot facility located in Carlsbad, Calif. The vertically integrated facility is ISO 13485 certified and is licensed by the State of California to manufacture sterile, single-use catheters in controlled environments.

Cautionary Note Regarding Forward Looking Statements

This press release contains forward-looking statements within the meaning of the Private Securities Litigation Reform Act of 1995. Forward-looking statements generally relate to future events or Ra Medical’s future financial or operating performance. In some cases, you can identify forward-looking statements because they contain words such as “may,” “will,” “should,” “expects,” “plans,” “anticipates,” “could,” “intends,” “target,” “projects,” “contemplates,” “believes,” “estimates,” “predicts,” “potential” or “continue” or the negative of these words or other similar terms or expressions that concern Ra Medical’s future expectations, strategy, plans or intentions. Forward-looking statements in this press release include, but are not limited to, statements regarding Ra Medical’s business strategy. Ra Medical’s expectations and beliefs regarding these matters may not materialize, and actual results in future periods are subject to risks and uncertainties that could cause actual results to differ materially from those projected or implied by such forward-looking statements. The potential risks and uncertainties which contribute to the uncertain nature of these statements include, among others, challenges inherent in developing, manufacturing, launching, marketing, and selling new products; risks associated with acceptance of DABRA and Pharos and procedures performed using such devices by physicians, payors, and other third parties; development and acceptance of new products or product enhancements; clinical and statistical verification of the benefits achieved via the use of Ra Medical’s products; the results from our clinical trials, which may not support intended indications or may require Ra Medical to conduct additional clinical trials or modify ongoing clinical trials; challenges related to commencement, patient enrollment, completion, an analysis of clinical trials; Ra Medical’s ability to manage operating expenses; Ra Medical’s ability to effectively manage inventory; Ra Medical’s ability to recruit and retain management and key personnel; Ra Medical’s need to comply with complex and evolving laws and regulations; intense and increasing competition and consolidation in Ra Medical’s industry; the impact of rapid technological change; costs and adverse results in any ongoing or future legal proceedings; adverse outcome of regulatory inspections; and the other risks and uncertainties described in Ra Medical’s news releases and filings with the Securities and Exchange Commission. Information on these and additional risks, uncertainties, and other information affecting Ra Medical’s business and operating results is contained in Ra Medical’s Annual Report on Form 10-K for the year ended December 31, 2019 and in its other filings with the Securities and Exchange Commission. Additional information will also be set forth in Ra Medical’s Quarterly Report on Form 10-Q for the quarterly period ended September 30, 2020 to be filed with the Securities and Exchange Commission. The forward-looking statements in this press release are based on information available to Ra Medical as of the date hereof, and Ra Medical disclaims any obligation to update any forward-looking statements, except as required by law.

Ra Medical investors and others should note that we announce material information to the public about the company through a variety of means, including our website (www.ramed.com), our investor relations website (https://ir.ramed.com/), press releases, SEC filings and public conference calls in order to achieve broad, non-exclusionary distribution of information to the public and to comply with our disclosure obligations under Regulation FD. We encourage our investors and others to monitor and review the information we make public in these locations as such information could be deemed to be material information. Please note that this list may be updated from time to time.

Ra Medical Systems, Inc.

Condensed Balance Sheets

(Unaudited)

(in thousands)

 
September 30,
2020
December 31,
2019
ASSETS
Current Assets
Cash and cash equivalents

$

33,646

$

14,584

Short-term investments


15,993

Accounts receivable, net


475


786

Inventories


2,592


2,777

Prepaid expenses and other current assets


466


1,860

Total current assets


37,179


36,000

Property and equipment, net


3,581


5,050

Operating lease right-of-use-assets


2,574


2,835

Other non-current assets


120


196

TOTAL ASSETS

$

43,454

$

44,081

 
LIABILITIES AND STOCKHOLDERS’ EQUITY
Current Liabilities
Accounts payable

$

899

$

1,532

Accrued expenses


4,591


2,642

Current portion of deferred revenue


1,729


2,029

Current portion of equipment financing


306


293

Current portion of promissory note


168


Current portion of operating lease liabilities


346


318

Total current liabilities


8,039


6,814

Deferred revenue


656


1,232

Equipment financing


34


265

Promissory note


1,832


Operating lease liabilities


2,355


2,620

Total liabilities


12,916


10,931

Total stockholders’ equity


30,538


33,150

TOTAL LIABILITIES AND STOCKHOLDERS’ EQUITY

$

43,454

$

44,081

Ra Medical Systems, Inc.

Condensed Statements of Operations

(Unaudited)

(in thousands, except per share data)

 
Three Months Ended September 30, Nine Months Ended September 30,


2020


2019


2020


2019


Net revenue
Product sales

$

183


$

1,078


$

923


$

3,256


Service and other


731


830


2,265


2,553


Total net revenue


914


1,908


3,188


5,809


Cost of revenue
Product sales


670


1,518


2,258


4,848


Service and other


748


907


1,911


2,252


Total cost of revenue


1,418


2,425


4,169


7,100


Gross loss


(504

)


(517

)


(981

)


(1,291

)

Operating expenses
Selling, general and administrative


4,933


15,889


19,114


42,907


Research and development


2,332


1,182


5,580


3,692


Total operating expenses


7,265


17,071


24,694


46,599


Operating loss


(7,769

)


(17,588

)


(25,675

)


(47,890

)

Other income (expense), net


(10

)


173


74


684


Loss before income tax expense


(7,779

)


(17,415

)


(25,601

)


(47,206

)

Income tax expense


3


8


Net loss

$

(7,779

)

$

(17,418

)

$

(25,601

)

$

(47,214

)

Basic and diluted net loss per share

$

(0.13

)

$

(1.30

)

$

(0.79

)

$

(3.63

)

Basic and diluted weighted average common shares outstanding


59,638


13,370


32,443


13,023


Ra Medical Systems, Inc.

Non-GAAP Reconciliations

(Unaudited)

(in thousands)

 
Three Months Ended September 30, Nine Months Ended September 30,


2020


2019


2020


2019


Statements of Operations Data:
Net loss

$

(7,779

)

$

(17,418

)

$

(25,601

)

$

(47,214

)

Depreciation and amortization


631


460


1,845


1,291


Interest income


(4

)


(245

)


(128

)


(870

)

Interest expense


14


72


54


186


Income tax expense


3


8


EBITDA


(7,138

)


(17,128

)


(23,830

)


(46,599

)

Stock-based compensation


964


7,277


3,044


22,154


Adjusted EBITDA

$

(6,174

)

$

(9,851

)

$

(20,786

)

$

(24,445

)


At the Company:

Jeffrey Kraws

President, Ra Medical Systems

760-496-9008

[email protected]

Investors:

LHA Investor Relations

Jody Cain

310-691-7100

[email protected]

KEYWORDS: United States North America California New York

INDUSTRY KEYWORDS: Medical Devices Health Diabetes Research Science Cardiology

MEDIA:

Logo
Logo

Retrophin Completes Acquisition of Orphan Technologies

Addition of OT-58 strengthens pipeline of potential first-in-class therapies targeting rare diseases

SAN DIEGO, Nov. 12, 2020 (GLOBE NEWSWIRE) — Retrophin, Inc. (NASDAQ: RTRX) today announced the completion of its previously announced acquisition of Orphan Technologies Limited, a privately held, clinical-stage biopharmaceutical company focused on the development of product candidate OT-58 for the treatment of classical homocystinuria (HCU). OT-58 is a novel investigational human enzyme replacement therapy being evaluated in Phase 1/2 development for the treatment of classical HCU, a rare metabolic disorder characterized by elevated levels of plasma homocysteine that can lead to life-threatening thrombotic events such as stroke and heart attacks, ophthalmologic and skeletal complications, as well as developmental delay.

“We are excited to begin working with the HCU community to develop a deeper understanding of how we can continue to integrate their perspectives into the development of OT-58, and help address their unmet needs,” said Eric Dube, Ph.D., chief executive officer of Retrophin. “We look forward to building upon the promising potential of OT-58 with the goal of developing and ultimately delivering the first disease modifying therapy for people living with HCU.”

Under the terms of the agreement, Retrophin made an upfront payment of $90 million in cash at closing of the transaction. Orphan Technologies shareholders will remain eligible to receive up to $427 million in additional cash payments contingent upon the achievement of key milestones in the development and commercialization of OT-58. Retrophin will also pay a tiered mid-single digit royalty on future net sales of OT-58 in the US and Europe, and potentially make a milestone payment in the event a rare pediatric disease priority review voucher is granted.

Barclays acted as financial advisor, and Cooley LLP acted as legal counsel to Retrophin. Cantor Fitzgerald & Co. acted as financial advisor, and Hogan Lovells US LLP acted as legal counsel to Orphan Technologies.

About
Classical Homocystinuria

Classical homocystinuria (HCU) is a rare genetic metabolic disorder caused by a deficiency in the enzyme cystathionine beta synthase (CBS). CBS is a pivotal enzyme that is essential for the management of methionine and cysteine in the body. Classical HCU leads to toxic levels of homocysteine that can result in life-threatening thrombotic events such as stroke and heart attacks, ophthalmologic and skeletal complications, as well as developmental delay. Current treatment options are limited to protein-restricted diet and supplemental use of vitamin B6 and betaine.

About Retrophin

Retrophin is a biopharmaceutical company specializing in identifying, developing and delivering life-changing therapies to people living with rare disease. The Company’s approach centers on its pipeline featuring sparsentan, a product candidate in late-stage development for focal segmental glomerulosclerosis (FSGS) and IgA nephropathy (IgAN), rare disorders characterized by progressive scarring of the kidney often leading to end-stage renal disease. Research in additional rare diseases is also underway, including partnerships with leaders in patient advocacy and government research to identify potential therapeutics for NGLY1 deficiency and Alagille syndrome, conditions with no approved treatment options. Retrophin’s R&D efforts are supported by revenues from the Company’s commercial products Chenodal®, Cholbam®, Thiola® and Thiola EC®.

Retrophin.com

About 
Orphan Technologies

Orphan Technologies is a clinical-stage biopharmaceutical company focused on the development of OT-58. OT-58 is an investigational human enzyme replacement therapy being evaluated in Phase 1/2 development for the treatment of classical homocystinuria (HCU). HCU is a rare metabolic disorder characterized by elevated levels of plasma homocysteine that can lead to life-threatening thrombotic events such as stroke and heart attacks, ophthalmologic and skeletal complications, as well as developmental delay.

Forward-Looking Statements

This press release contains “forward-looking statements” as that term is defined in the Private Securities Litigation Reform Act of 1995. Without limiting the foregoing, these statements are often identified by the words “may”, “might”, “believes”, “thinks”, “anticipates”, “plans”, “expects”, “intends” or similar expressions. In addition, expressions of our strategies, intentions or plans are also forward-looking statements. Such forward-looking statements include, but are not limited to, references related to; the potential impact upon and benefits to Retrophin from the acquisition of Orphan Technologies; the potential for OT-58 to ultimately become the first disease modifying therapy for HCU; and references to the achievement of future potential development and commercialization milestones for the OT-58 program, including, without limitation, the potential future issuance of a rare pediatric disease priority review voucher. Such forward-looking statements are based on current information available to Retrophin and involve inherent risks and uncertainties, including factors that could delay, divert or change any such forward-looking statements, and could cause actual outcomes and results to differ materially from current expectations. No forward-looking statement can be guaranteed. Retrophin faces risks associated with, but not limited to: Retrophin’s ability to realize the anticipated benefits of the proposed transaction, including the potential developmental and commercial success of the OT-58 product candidate; significant and unknown transaction costs; actual or contingent liabilities; the risk of litigation and/or regulatory actions related to the transaction; other business effects outside of Retrophin’s control, including the effects of industry, market, economic, political or regulatory conditions or the ongoing COVID-19 pandemic; as well as negative impacts that could result from changes in tax and other laws, regulations, rates and policies. In addition, such risks and uncertainties may include those described in Retrophin’s annual, quarterly and current reports (i.e., Form 10-K, Form 10-Q and Form 8-K) as filed or furnished with the Securities and Exchange Commission, which are available at Retrophin’s website (www.retrophin.com) under “Investors & Media”. You are cautioned not to place undue reliance on any forward-looking statements as there are important factors that could cause actual results to differ materially from those in any forward-looking statements, many of which are beyond our control. Except to the extent required by law, Retrophin undertakes no obligation to publicly update any forward-looking statement.

Contact:
Chris Cline, CFA
Senior Vice President, Investor Relations & Corporate Communications
888-969-7879
[email protected]

Realize the Full Potential of the NextSeq 2000 with the Power of the P3 Reagent Kit

Realize the Full Potential of the NextSeq 2000 with the Power of the P3 Reagent Kit

Now Commercially Available, Both NextSeq 1000 and NextSeq 2000 Sequencers Include Integrated Informatics and Loss-less Compression Technology, Creating an Intuitive User Experience

SAN DIEGO–(BUSINESS WIRE)–
. Illumina, Inc. (NASDAQ: ILMN) is further extending the reach of the NextSeq™ 2000 Sequencing System with the commercial availability of the P3 high-output flow cell. The P3 flow cell offers 1.1 billion reads in a single sequencing run, almost three times more than previously available on Illumina’s mid-throughput NextSeq sequencing portfolio, expanding the range of applications that run on the system.

This press release features multimedia. View the full release here: https://www.businesswire.com/news/home/20201112005974/en/

Now commercially available, Illumina's NextSeq 1000 and NextSeq 2000 (shown here) Sequencers include integrated informatics and loss-less compression technology, creating an intuitive user experience. (Photo: Business Wire)

Now commercially available, Illumina’s NextSeq 1000 and NextSeq 2000 (shown here) Sequencers include integrated informatics and loss-less compression technology, creating an intuitive user experience. (Photo: Business Wire)

“The advanced yet affordable P3 flow cell for the NextSeq 2000 gives customers more capacity to increase the depth and breadth of their projects and the ability to stretch their project budgets, yielding deeper insights,” said Susan Tousi, Chief Product Officer of Illumina. “We’re pleased to further instill customer confidence with the highest data quality ever achieved at commercial launch. Together with the on-instrument integration of our award-winning informatics solution and loss-less compression software, customers can extract actionable insights with a seamless user interface.”

“At University of Edinburgh, our genomics work includes single cell RNA sequencing projects which are often limited by cost,” said Lee Murphy, Head of the Genetics Core at the Edinburgh Clinical Research Facility. “With the NextSeq 2000 and P3 kits, we are experiencing higher output enabling more complex, informative studies which increases the value of our offerings to our world class researchers.”

“The NextSeq 2000 has enabled us to bring sequencing in-house that we would otherwise have to outsource,” said Bryan Venters, Director of Genomic Technologies at EpiCypher, an epigenetic technology company located in North Carolina. “This is critical because it gives us control over our development pipeline. With the release of the P3 cartridge, it will enable higher throughput sequencing and faster turnaround times.”

The P3 flow cell is available in four configurations, including 100-, 200- and 300-cycles, delivering 110 Gb, 220 Gb, and 330 Gb per run, respectively. In response to customer feedback, Illumina is also launching a 50-cycle kit, targeting infectious disease, small RNA, and spatial transcriptomics applications. Additionally, at the outset of 2021, the NextSeq1000 and NextSeq 2000 platforms will come with a tool designed to allow easy recycling of >60% of the reagent cartridge used in each sequencing run.

Illumina also announced the commercial availability of the NextSeq 1000, with an even more accessible price point for sequencing up to 400 million reads per run. Like the NextSeq 2000, the NextSeq 1000 offers onboard informatics for rapid secondary analysis and cloud-based, loss-less compression technology – the first of its kind to offer genomic compression technology built-in. The systems were designed with customers in mind, offering not only a clearer path to deep, actionable insights, but also our most intuitive user experience yet.

“Both the NextSeq 1000 and NextSeq 2000 are designed to simplify workflows and empower labs of any size with the economy of scale to sequence more, more frequently,” said Mark Van Oene, Chief Commercial Officer of Illumina. “With lower run costs, we’re empowering our customers to more freely pursue their research ideas and drive genomics forward.”

The NextSeq 1000 and NextSeq 2000, as well as the P2 and P3 flow cells, are now shipping.

To learn more, visit our website.

About Illumina

Illumina is improving human health by unlocking the power of the genome. Our focus on innovation has established us as the global leader in DNA sequencing and array-based technologies, serving customers in the research, clinical and applied markets. Our products are used for applications in the life sciences, oncology, reproductive health, agriculture and other emerging segments. To learn more, visit www.illumina.com and connect with us on Twitter, Facebook, LinkedIn, Instagram, and YouTube.

Use of forward-looking statements

This release contains forward-looking statements that involve risks and uncertainties, including the expectation for lower costs related to the storing and managing of genomic data costs. Among the important factors that could cause actual results to differ materially from those in any forward-looking statements are: (i) challenges inherent in developing and launching new products and services; (ii) our ability to deploy new products, services, and applications, and to expand the markets for our technology platforms; and (iii) the acceptance by customers of our newly launched products, together with other factors detailed in our filings with the Securities and Exchange Commission, including our most recent filings on Forms 10-K and 10-Q, or in information disclosed in public conference calls, the date and time of which are released beforehand. We undertake no obligation, and do not intend, to update these forward-looking statements, to review or confirm analysts’ expectations, or to provide interim reports or updates on the progress of the current quarter.

Media:

Karen Birmingham, PhD

646-355-2111

[email protected]

Investors:

Juliet Cunningham

858-882-2171

[email protected]

KEYWORDS: United States North America California

INDUSTRY KEYWORDS: Health Technology Other Technology Genetics Research Science

MEDIA:

Logo
Logo
Photo
Photo
Now commercially available, Illumina’s NextSeq 1000 and NextSeq 2000 (shown here) Sequencers include integrated informatics and loss-less compression technology, creating an intuitive user experience. (Photo: Business Wire)

NCR to Present at Upcoming Investor Conferences

NCR to Present at Upcoming Investor Conferences

ATLANTA–(BUSINESS WIRE)–
NCR Corporation (NYSE: NCR), a global enterprise technology provider for the banking, retail and hospitality industries, today announced that President and Chief Executive Officer Michael D. Hayford will present to investors at the RBC Capital Markets Technology, Internet, Media and Telecommunications Virtual Conference on Nov. 17, 2020 at 1:20 p.m. Eastern Time.

Chief Financial Officer Tim Oliver will present to investors at the Bank of America Leveraged Finance Virtual Conference on Nov. 30, 2020, at 8:15 a.m. Eastern Time.

Additionally, Tim Oliver will present to investors at the Wells Fargo Securities Virtual TMT Summit on Dec. 1, 2020 at 1:20 p.m. Eastern Time.

A live webcast and replay of the sessions will be available in the Investor Relations section of NCR.com (investor.ncr.com) for 90 days following the sessions.

About NCR Corporation

NCR Corporation (NYSE: NCR) is a leading software- and services-led enterprise provider in the financial, retail and hospitality industries. NCR is headquartered in Atlanta, Ga., with 36,000 employees and does business in 180 countries. NCR is a trademark of NCR Corporation in the United States and other countries.

Web site: www.ncr.com

Twitter: @NCRCorporation

Facebook: www.facebook.com/ncrcorp

LinkedIn: www.linkedin.com/company/ncr-corporation

YouTube: www.youtube.com/user/ncrcorporation

Investor Contact

Michael Nelson

NCR Corporation

678-808-6995

[email protected]

Media Contact

Scott Sykes

NCR Corporation

212-589-8428

[email protected]

KEYWORDS: Georgia United States North America

INDUSTRY KEYWORDS: Technology Software

MEDIA:

Logo
Logo

Agile Therapeutics Reports Third Quarter 2020 Financial Results

Commercial Launch of Twirla® Expected by Year-End 2020

$71.9 Million in Cash, Cash Equivalents, and Marketable Securities as of September 30, 2020

Management to Host Conference Call today at 4:30 PM ET

PRINCETON, N.J., Nov. 12, 2020 (GLOBE NEWSWIRE) — Agile Therapeutics, Inc. (Nasdaq: AGRX), a women’s healthcare company, today reported financial results for the three and nine months ended September 30, 2020 and provided a corporate update.

“With our commercial launch of Twirla expected by the end of the year, we remain on track to deliver on our plan. The final validation of our commercial manufacturing process continues to progress as all three of our batches are expected to be released for commercial use in December 2020. By taking steps to build out an experienced sales force, secure major wholesaler agreements and increase market access for Twirla, we believe we are well-prepared to hit the ground running. Having our first FDA-approved product nearing launch marks an exciting time for Agile and we look forward to bringing to the market another choice for women to help fulfill their contraceptive needs,” said Al Altomari, Chairman and Chief Executive Officer of Agile.

Third Quarter 2020 and Other Recent Corporate Developments:

Twirla Commercialization Update

  • The Company intends to begin shipping product to wholesalers by year-end 2020.
     
  • Agile remains on track to finalize the validation of its commercial manufacturing process of Twirla.
    •  All three validation batches are expected to be released for commercial use in December 2020.
     
  • The Company continued to build its distribution network by entering into an agreement with a third major U.S. wholesaler.
     
  • The Company continues to build awareness among prescribers and health care providers to gain market access for Twirla.
    •  Product sampling expected to begin at launch.
     
  • Through Syneos Selling Solutions, the Company’s contract sales force partner, Agile completed the hiring of an initial sales team of 73 persons.
    •  The sales force initiated discussions with healthcare providers after it was fully deployed in mid-October.

Strengthened Executive Leadership Team

  • In August 2020, the Company appointed Paul Korner, MD, MBA, as Chief Medical Officer. Dr. Korner is a board-certified obstetrician and gynecologist with more than 20 years of pharmaceutical and biotech industry experience, including significant experience within women’s healthcare.

Launched I’m So Done – A National Unbranded Campaign

  • In September 2020, the Company launched I’m So Done, an education and empowerment platform that encourages women to think about their current contraceptive method and decision-making journey.

Financial Guidance

  • The Company narrowed its operating expense guidance for the full year 2020 to be in the range of $52 million to $54 million, with general and administrative expenses accounting for approximately 70% of the spending as it builds out its commercial infrastructure. The Company’s operating expenses guidance includes $2.7 million to $3 million of non-cash stock compensation expense.  The Company expects its gross revenue in the fourth quarter of 2020, reflecting expectations of initial stocking of Twirla by wholesalers, to be approximately $1 million.
     
  • Based on the Company’s current business plan and pending launch of Twirla, the Company believes that its cash, cash equivalents and marketable securities as of September 30, 2020 will be sufficient to meet its projected operating requirements through the end of 2021.  If the COVID-19 pandemic or other factors impact the Company’s current business plans or its ability to generate revenue from the launch of Twirla, the Company believes it has the ability to revise its commercial plans, including curtailing sales and marketing spending, to allow it to continue to fund its operations.

Third Quarter Financial Results

  • Cash, cash equivalents and marketable securities
    As of September 30, 2020, Agile had $71.9 million of cash, cash equivalents and marketable securities compared to $34.5 million of cash and cash equivalents as of December 31, 2019.
     
  • Research and development (R&D) expenses:  R&D expenses were $3.7 million for the quarter ended September 30, 2020, compared to $2.4 million for the comparable period in 2019. The increase in R&D expenses was primarily due to costs to conduct validation work for commercial manufacturing of Twirla by Corium, the Company’s contract manufacturer. 
     
  • General and administrative (G&A) expenses:  G&A expenses were $11.0 million for the quarter ended September 30, 2020, compared to $2.1 million for the comparable period in 2019.  The increase in G&A expenses was primarily due to higher costs associated with the Company’s pre-commercialization activities for Twirla, such as brand building, advocacy, market research and consulting.  The increase in G&A expenses was also attributable to activities related to building out the commercial organization and included higher salaries and higher professional fees related to recruiting fees and consultants, and an increase in stock compensation expense.
     
  • Net loss:  Net loss was $15.5 million, or $0.18 per share, for the quarter ended September 30, 2020, compared to a net loss of $4.4 million, or $0.08 per share, for the comparable period in 2019.
     
  • Shares Outstanding:  As of September 30, 2020, Agile had 87,434,604 shares of common stock outstanding.

Conference Call and Webcast
Agile Therapeutics will host a conference call and webcast to discuss financial results for the third quarter ended September 30, 2020 today at 4:30pm ET. Investors interested in listening to the conference call may do so by dialing (877) 407-2991 for domestic callers or (201) 389-0925 for international callers. A live webcast will be available in the Events and Presentations section of the Investor Relations page at https://ir.agiletherapeutics.com/events-and-presentations/, or by clicking here.

Please log in approximately 10 minutes prior to the scheduled start time. The archived webcast will be available in the Events and Presentations section of the Company’s website.

About Twirla®
Twirla (levonorgestrel and ethinyl estradiol) transdermal system is a once-weekly combined hormonal contraceptive (CHC) patch that contains the active ingredients levonorgestrel (LNG), a type of progestin, and ethinyl estradiol (EE), a type of estrogen. Twirla is indicated for use as a method of contraception by women of reproductive potential with a body mass index (BMI) < 30 kg/m2 for whom a combined hormonal contraceptive is appropriate to prevent pregnancy. Healthcare providers (HCPs) are encouraged to consider Twirla’s reduced efficacy in women with a BMI ≥ 25 to <30 kg/m2 before prescribing.  Twirla is contraindicated in women with a BMI ≥ 30 kg/m2. Twirla is designed to be applied once weekly for three weeks, followed by a week without a patch.

About Agile Therapeutics, Inc.

Agile Therapeutics is a women’s healthcare company dedicated to fulfilling the unmet health needs of today’s women.  Our product candidates are designed to provide women with contraceptive options that offer freedom from taking a daily pill, without committing to a longer-acting method.  Our initial product, Twirla®, (levonorgestrel and ethinyl estradiol) transdermal system is a non-daily prescription contraceptive. Twirla is based on our proprietary transdermal patch technology, called Skinfusion®, which is designed to allow drug delivery through the skin. For more information, please visit the company website at www.agiletherapeutics.com. The Company may occasionally disseminate material, nonpublic information on the Company’s website.

Forward-Looking Statement

Certain information contained in this press release includes “forward-looking statements” within the meaning of Section 27A of the Securities Act of 1933, as amended, and Section 21E of the Securities Exchange Act of 1934, as amended. We may in some cases use terms such as “predicts,” “believes,” “potential,” “continue,” “anticipates,” “estimates,” “expects,” “plans,” “intends,” “may,” “could,” “might,” “likely,” “will,” “should” or other words that convey uncertainty of the future events or outcomes to identify these forward-looking statements. Our forward-looking statements are based on current beliefs and expectations of our management team that involve risks, potential changes in circumstances, assumptions, and uncertainties, including statements regarding the status and timing of the validation of our commercial manufacturing process, market availability of Twirla, our projected cash position, our projected fiscal year 2020 operating expenses and gross and net revenue and the expected timing and structure of our commercialization plan for Twirla.  Any or all of the forward-looking statements may turn out to be wrong or be affected by inaccurate assumptions we might make or by known or unknown risks and uncertainties. These forward-looking statements are subject to risks and uncertainties including risks related to our ability to maintain regulatory approval of Twirla, our ability along with our third-party manufacturer, Corium, to complete successfully the scale-up of the commercial manufacturing process for Twirla, the performance and financial condition of Corium or any of its suppliers, the ability of Corium to produce commercial supply in quantities and quality sufficient to satisfy market demand for Twirla, our ability to successfully commercialize Twirla, the successful development of our sales and marketing capabilities, the accuracy of our estimates of the potential market for Twirla, regulatory and legislative developments in the United States and foreign countries, our ability to obtain and maintain intellectual property protection for Twirla, our strategy, business plans and focus, the effects of the COVID-19 pandemic on our operations and the operations of third parties we rely upon as well as on our potential customer base, and the other risks set forth in our filings with the U.S. Securities and Exchange Commission, including our Annual Report on Form 10-K and our Quarterly Reports on Form 10-Q.  For all these reasons, actual results and developments could be materially different from those expressed in or implied by our forward-looking statements. You are cautioned not to place undue reliance on these forward-looking statements, which are made only as of the date of this press release. We undertake no obligation to publicly update such forward-looking statements to reflect subsequent events or circumstances.

Contact: 
Matt Riley
Head of Investor Relations & Corporate Communications
[email protected]        

Agile Therapeutics, Inc.

Balance Sheets

(Unaudited)

(in thousands, except par value and share data)

           
  September 30,   December 31,
  2020
     2019
Assets          
Current assets:          
Cash and cash equivalents $  24,163     $  34,479  
Marketable securities    47,742        —  
Prepaid expenses    1,414        840  
Total current assets    73,319        35,319  
Property and equipment, net    14,271        14,044  
Right of use asset    31        158  
Other non-current assets    1,791        19  
Total assets $  89,412     $  49,540  
           
Liabilities and stockholders’ equity          
Current liabilities:          
Accounts payable $  5,016     $  1,819  
Accrued expenses    2,154        1,804  
Lease liability, current portion    34        172  
Total current liabilities    7,204        3,795  
           
Long-term debt    16,078        —  
Total liabilities    23,282        3,795  
Commitments and contingencies          
Stockholders’ equity          
Common stock, $.0001 par value, 150,000,000 shares authorized, 87,434,604 and 69,810,305 issued and outstanding at September 30, 2020 and December 31, 2019, respectively    9        7  
Additional paid-in capital    360,713        306,108  
Accumulated other comprehensive income    11        —  
Accumulated deficit    (294,603 )      (260,370 )
Total stockholders’ equity    66,130        45,745  
Total liabilities and stockholders’ equity $  89,412     $  49,540  

Agile Therapeutics, Inc.

Statements of Operations

(Unaudited)

(in thousands, except per share and share data)

                       
  Three Months Ended   Nine Months Ended
  September 30,    September 30, 
  2020      2019      2020      2019
Operating expenses:                      
Research and development $ 3,663     $ 2,361     $ 10,488     $ 7,021  
General and administrative   10,993       2,138       21,824       5,732  
Total operating expenses   14,656       4,499       32,312       12,753  
Loss from operations   (14,656 )     (4,499 )     (32,312 )     (12,753 )
                       
Other income (expense)                      
Interest income   37       67       284       168  
Interest expense   (905 )           (2,205 )      
Total other income (expense), net   (868 )     67       (1,921 )     168  
Loss before benefit from income taxes   (15,524 )     (4,432 )     (34,233 )     (12,585 )
Benefit from income taxes                      
Net loss $ (15,524 )   $ (4,432 )   $ (34,233 )   $ (12,585 )
                       
Net loss per share (basic and diluted) $ (0.18 )   $ (0.08 )   $ (0.41 )   $ (0.28 )
                       
Weighted-average common shares (basic and diluted)   87,350,505       53,609,511       83,754,550       44,957,809  
                       
Comprehensive loss:                      
Net loss $ (15,524 )   $ (4,432 )   $ (34,233 )   $ (12,585 )
Other comprehensive income:                      
   Unrealized gain on marketable securities   1             11        
Comprehensive loss $ (15,523 )   $ (4,432 )   $ (34,222 )   $ (12,585 )

Domo Announces Timing of its Third Quarter Fiscal 2021 Results Conference Call

Domo Announces Timing of its Third Quarter Fiscal 2021 Results Conference Call

SILICON SLOPES, Utah–(BUSINESS WIRE)–Domo (Nasdaq: DOMO), provider of the Business Cloud, today announced that results for its third quarter fiscal 2021 (ended October 31, 2020) will be released on December 3, 2020, after the close of the market. The company will host a conference call at 3:00 p.m. (MT) / 5:00 p.m. (ET) to discuss its financial results with the investment community.

Participants can register for the call in advance by visiting http://www.directeventreg.com/registration/event/4296169. Instructions will be shared on how to join the call after registering. A live webcast of the event will be available on the Domo Investor Relations website at http://www.domo.com/IR.

A replay will be available at (800) 585-8367 or (416) 621-4642 with conference ID #4296169 following the completion of the conference call until 11:59p.m. (ET) December 17, 2020.

About Domo

Domo is the Business Cloud, empowering organizations of all sizes with BI leverage at cloud scale, in record time. With Domo, BI-critical processes that took weeks, months or more can now be done on-the-fly, in minutes or seconds, at unbelievable scale. For more information about how Domo (Nasdaq: DOMO) helps its customers go fast, go big and go bold, visit www.domo.com. You can also follow Domo on Twitter, Facebook and LinkedIn.

Domo Disclosure Channels to Disseminate Information

Domo investors and others should note that we announce material information to the public about our company, products and services, and other issues through a variety of means, including Domo’s website, press releases, SEC filings, blogs and social media, in order to achieve broad, non-exclusionary distribution of information to the public. We intend to use the Domo Facebook page, the Domo LinkedIn page, the Domo blog, the @Domotalk Twitter account and the @JoshJames Twitter account as a means of disclosing information about the Company and its services and for complying with the disclosure obligations under Regulation FD. The information we post through these social media channels may be deemed material. Accordingly, we encourage investors and others to monitor these social media channels in addition to following our press releases, SEC filings and public conference calls and webcasts. The social media channels that we intend to use as a means of disclosing the information described here may be updated from time to time as listed on our investor relations webpage.

Domo, Domo Business Cloud and Domo is the Business Cloud are registered trademarks of Domo, Inc.

Media –

Julie Kehoe

[email protected]

Investors –

Peter Lowry

[email protected]

KEYWORDS: Utah United States North America

INDUSTRY KEYWORDS: Software Technology Data Management

MEDIA:

Logo
Logo

LogicBio Therapeutics to Present at Upcoming Investor Conferences

LEXINGTON, Mass., Nov. 12, 2020 (GLOBE NEWSWIRE) — LogicBio Therapeutics, Inc. (Nasdaq:LOGC), a company dedicated to extending the reach of genetic medicine with pioneering targeted delivery today announced senior member of management will be presenting at upcoming investor conferences

  • COO Kyle Chiang will participate in fireside chat at the Barclay’s Gene Editing and Gene Therapy Summit on Monday November 16, 2020 at 8:15 AM ET
  • CEO Frederic Chereau will present at the Jeffries Virtual London Healthcare Conference Genetic Medicines Conference on Thursday, November 19, 2020 at 7:20 AM, ET.
  • CEO Frederic Chereau will record an on-demand presentation for the 32nd annual Piper Sandler Virtual Healthcare Conference that will be made available to attendees of the conference beginning on November 30, 2020.

Links to all presentations will be available under the investors tab at www.logicbio.com upon their availability.

About
LogicBio
Therapeutics

LogicBio Therapeutics is dedicated to extending the reach of genetic medicine with pioneering targeted delivery platforms. LogicBio’s proprietary genome editing technology platform, GeneRide, enables the site-specific integration of a therapeutic transgene without nucleases or exogenous promoters by harnessing the native process of homologous recombination. LogicBio has received FDA clearance for the first-in-human clinical trial of LB-001, a wholly owned genome editing program leveraging GeneRide for the treatment of methylmalonic acidemia. Patient enrollment is expected to begin in early 2021. In addition, LogicBio has a collaboration with Takeda to research and develop LB-301, an investigational therapy leveraging GeneRide for the treatment of the rare pediatric disease Crigler-Najjar syndrome.

LogicBio is also developing a Next Generation Capsid platform for use in gene editing and gene therapies. Data presented have shown that the capsids deliver highly efficient functional transduction of human hepatocytes with improved manufacturability with low levels of pre-existing neutralizing antibodies in human samples. Top-tier capsid candidates from this effort demonstrated significant improvements over benchmark AAVs currently in clinical development. LogicBio is developing these highly potent vectors for internal development candidates and potentially for business development collaborations.

Contact:

Matthias Jaffe
Chief Financial Officer
[email protected]
(617) 245-0399

Digi International Reports Fourth Fiscal Quarter and Full Fiscal 2020 Results

Digi International Reports Fourth Fiscal Quarter and Full Fiscal 2020 Results

Record Annual Revenue of $279M, Full Year EPS at $0.28, Adjusted EPS grows 48% to $0.98

Balance Sheet Strengthens on over $15M Debt Pay Down

MINNEAPOLIS–(BUSINESS WIRE)–
Digi International® Inc. (Nasdaq: DGII), a leading global provider of business and mission critical Internet of Things (“IoT”) products, services and solutions, today announced its financial results for its fourth fiscal quarter and full fiscal year ended September 30, 2020.

Fourth Fiscal Quarter 2020 Results

  • Revenue increased to $73.2 million compared to $65.0 million, an increase of $8.2 million, or 12.6%.
  • Net income increased to $4.4 million compared to $2.3 million, an increase of $2.1 million, or 93.9%.
  • Net income per diluted share increased to $0.15 compared to $0.08 per diluted share, or 87.5%.
  • Adjusted EPS increased to $0.32 per diluted share compared to $0.18 per diluted share, or 77.8%.
  • Adjusted EBITDA increased to $12.1 million compared to $7.6 million, an increase of $4.5 million, or 58.3%.

Full Year 2020 Results

  • Revenue increased to $279.3 million compared to $254.2 million, an increase of $25.1 million, or 9.9%.
  • Net income decreased to $8.4 million compared to $10.0 million, a decrease of $1.6 million, or 15.5%.
  • Net income per diluted share decreased to $0.28 compared to $0.35 per diluted share, or 20.0%. Included in fiscal 2019 was a gain on the sale of our corporate headquarters building that contributed $0.12 (net of tax) per diluted share.
  • Adjusted EPS increased to $0.98 per diluted share compared to $0.66 per diluted share, or 48.5%.
  • Adjusted EBITDA increased to $40.2 million compared to $26.5 million, an increase of $13.7 million, or 51.8%.

Reconciliations of GAAP and non-GAAP financial measures appear at the end of this release.

“Digi delivered record revenue results for fiscal year 2020 amid the challenging macroeconomic backdrop, aided by the Opengear acquisition,” said Ron Konezny, President and Chief Executive Officer. “Our recent organizational change placing key leaders over each major product line will drive alignment, focus, and growth while sharpening our customer focus. In addition, we are excited to see our SmartSense IoT Solutions business return to growth with the capture of several enterprise customers, further building on our record annualized recurring revenue. Digi’s core value proposition enabling secure, automated, remote work has never been more relevant as our customers adapt during this pandemic era.”

Segment Results

IoT Product & Services

The segment’s fourth fiscal quarter 2020 revenues of $64.6 million increased 16.4% from the same period in the prior fiscal year. This increase is attributed primarily to the incremental revenue associated with our acquisition of Opengear, Inc. (“Opengear”) in December 2019. Gross profit margin increased 379 basis points to 51.6% of revenues for the fourth fiscal quarter of 2020. Products acquired through the acquisition of Opengear were the primary driver of the margin rate increase.

Full fiscal 2020 revenues of $249.5 million were a record for this segment, increasing 15.9% from the prior fiscal year. This increase is attributed primarily to the incremental revenue associated with our acquisition of Opengear. Gross profit margin increased 514 basis points to 51.8% of revenues for full fiscal 2020. Products acquired through the acquisition of Opengear drove the margin rate increase.

IoT Solutions

The segment’s fourth fiscal quarter 2020 revenues of $8.6 million decreased 9.5% from the same period in the prior fiscal year. This was due primarily to delays in customer rollouts, expansions and equipment upgrades largely as a result of the pandemic. We served just over 70,000 sites as of September 30, 2020, compared to just over 63,000 sites as of September 30, 2019. Gross profit margin increased 585 basis points to 48.5%, due to product and customer mix. This also demonstrated the value of our high margin recurring revenue business model.

Full fiscal 2020 revenues of $29.8 million decreased 23.6% from the prior fiscal year. Consistent with the fourth quarter, this decrease was due primarily to delays in customer rollouts, expansions and equipment upgrades largely as a result of the pandemic. Gross profit margin increased 160 basis points to 49.2% as a result of a greater mix of recurring revenue compared to the prior fiscal year.

Fiscal 2021 Guidance

Due to the ongoing uncertainties caused by the COVID-19 pandemic and the resulting dynamic macroeconomic conditions, Digi will not be providing financial guidance.

Fourth Fiscal Quarter 2020 Conference Call Details

As announced on October 9, 2020, Digi will discuss its fourth fiscal quarter and full year 2020 results on a conference call on Thursday, November 12, 2020 after market close at 5:00 p.m. ET (4:00 p.m. CT). The call will be hosted by Ron Konezny, President and Chief Executive Officer and Jamie Loch, Chief Financial Officer.

Digi invites all those interested in hearing management’s discussion of its quarter to access a live webcast of the conference call through the investor relations section of Digi’s website at www.digi.com. Participants may also join the call directly by dialing (855) 638-5675 and entering passcode 1997802. International participants may access the call by dialing (262) 912-4765 and entering passcode 1997802. A replay will be available within approximately three hours after the completion of the call, and for one week following the call, by dialing (855) 859-2056 for domestic participants or (404) 537-3406 for international participants and entering access code 1997802 when prompted.

A copy of this earnings release can be accessed through the financial releases page of the investor relations section of Digi’s website at www.digi.com.

For more news and information on us, please visit www.digi.com/aboutus/investorrelations.

About Digi International

Digi International (Nasdaq: DGII) is a leading global provider of IoT connectivity products, services and solutions. We help our customers create next-generation connected products and deploy and manage critical communications infrastructures in demanding environments with high levels of security and reliability. Founded in 1985, we’ve helped our customers connect over 100 million things and growing. For more information, visit Digi’s website at www.digi.com, or call 877–912–3444 (U.S.) or 952–912–3444 (International).

Forward-Looking Statements

This press release contains forward-looking statements that are based on management’s current expectations and assumptions. These statements often can be identified by the use of forward-looking terminology such as “assume,” “believe,” “anticipate,” “intend,” “estimate,” “target,” “may,” “will,” “expect,” “plan,” “potential,” “project,” “should,” or “continue,” or the negative thereof or other variations thereon or similar terminology. Among other items, these statements relate to expectations of the business environment in which Digi operates, projections of future performance, perceived marketplace opportunities and statements regarding our mission and vision. Such statements are not guarantees of future performance and involve certain risks, uncertainties and assumptions. Among others, these include risks related to the ongoing COVID-19 pandemic and efforts to mitigate the same, risks related to the economic downturn that commenced during the COVID-19 pandemic and the ability of companies like us to operate a global business in such conditions, the highly competitive market in which our company operates, rapid changes in technologies that may displace products sold by us, declining prices of networking products, our reliance on distributors and other third parties to sell our products, the potential for significant purchase orders to be canceled or changed, delays in product development efforts, uncertainty in user acceptance of our products, the ability to integrate our products and services with those of other parties in a commercially accepted manner, potential liabilities that can arise if any of our products have design or manufacturing defects, our ability to defend or settle satisfactorily any litigation, uncertainty in global economic conditions and economic conditions within particular regions of the world which could negatively affect product demand and the financial solvency of customers and suppliers, the impact of natural disasters and other events beyond our control that could negatively impact our supply chain and customers, potential unintended consequences associated with restructuring, reorganizations or other similar business initiatives that may impact our ability to retain important employees or otherwise impact our operations in unintended and adverse ways, the ability to achieve the anticipated benefits and synergies associated with acquisitions or divestitures and changes in our level of revenue or profitability which can fluctuate for many reasons beyond our control. These and other risks, uncertainties and assumptions identified from time to time in our filings with the United States Securities and Exchange Commission, including without limitation, our Annual Report on Form 10-K for the year ended September 30, 2019 and other filings, could cause our actual results to differ materially from those expressed in any forward-looking statements made by us or on our behalf. Many of such factors are beyond our ability to control or predict. These forward-looking statements speak only as of the date for which they are made. We disclaim any intent or obligation to update any forward-looking statements, whether as a result of new information, future events or otherwise.

Presentation of Non-GAAP Financial Measures

This release includes adjusted net income, adjusted net income per diluted share and Adjusted EBITDA, each of which is a non-GAAP measure.

We understand that there are material limitations on the use of non-GAAP measures. Non-GAAP measures are not substitutes for GAAP measures, such as net income, for the purpose of analyzing financial performance. The disclosure of these measures does not reflect all charges and gains that were actually recognized by Digi. These non-GAAP measures are not in accordance with, or an alternative for measures prepared in accordance with, generally accepted accounting principles and may be different from non-GAAP measures used by other companies or presented by us in prior reports. In addition, these non-GAAP measures are not based on any comprehensive set of accounting rules or principles. We believe that non-GAAP measures have limitations in that they do not reflect all of the amounts associated with our results of operations as determined in accordance with GAAP. We believe these measures should only be used to evaluate our results of operations in conjunction with the corresponding GAAP measures. Additionally, Adjusted EBITDA does not reflect our cash expenditures, the cash requirements for the replacement of depreciated and amortized assets, or changes in or cash requirements for our working capital needs.

We believe that providing historical and adjusted net income and adjusted net income per diluted share, respectively, exclusive of such items as reversals of tax reserves, discrete tax benefits, restructuring charges and reversals, intangible amortization, stock-based compensation, other non-operating income/expense, adjustments to estimates of contingent consideration, acquisition-related expenses, interest expense related to acquisition and gains from the disposition of our former corporate headquarters permits investors to compare results with prior periods that did not include these items. Management uses the aforementioned non-GAAP measures to monitor and evaluate ongoing operating results and trends and to gain an understanding of our comparative operating performance. In addition, certain of our stockholders have expressed an interest in seeing financial performance measures exclusive of the impact of these matters, which while important, are not central to the core operations of our business. Management believes that Adjusted EBITDA, defined as EBITDA adjusted for stock-based compensation expense, acquisition-related expenses, restructuring charges and reversals, and gains from the disposition of our former corporate headquarters is useful to investors to evaluate our core operating results and financial performance because it excludes items that are significant non-cash or non-recurring items reflected in the Condensed Consolidated Statements of Operations. We believe that the presentation of Adjusted EBITDA as a percentage of revenue is useful because it provides a reliable and consistent approach to measuring our performance from year to year and in assessing our performance against that of other companies. We believe this information helps compare operating results and corporate performance exclusive of the impact of our capital structure and the method by which assets were acquired.

For more information, visit Digi’s website at www.digi.com, or call 877-912-3444 (U.S.) or 952-912-3444 (International).

Digi International Inc.

Condensed Consolidated Statements of Operations

(In thousands, except per share amounts)

(Unaudited)


Three months ended September 30,


Fiscal year ended September 30,


2020


2019


2020


2019

Revenue

$

73,169


$

64,960


$

279,271


$

254,203


Cost of sales

35,651


34,365


135,299


135,168


Gross profit

37,518


30,595


143,972


119,035


Operating expenses:


Sales and marketing

13,011


11,218


52,761


45,801


Research and development

11,010


9,893


43,765


37,564


General and administrative

8,288


7,376


36,012


25,685


Restructuring (reversal) charge

(12

)


117


(87

)

Operating expenses

32,297


28,487


132,655


108,963


Operating income

5,221


2,108


11,317


10,072


Other (expense) income, net

(877

)


479


(3,854

)


1,073


Income before income taxes

4,344


2,587


7,463


11,145


Income tax (benefit) expense

(89

)


301


(948

)


1,187


Net income

$

4,433


$

2,286


$

8,411


$

9,958


Net income per common share:


Basic

$

0.15


$

0.08


$

0.29


$

0.36


Diluted

$

0.15


$

0.08


$

0.28


$

0.35


Weighted average common shares:


Basic

29,079


28,172


28,849


27,905


Diluted

29,678


28,916


29,546


28,554


Digi International Inc.

Condensed Consolidated Balance Sheets

(In thousands)

(Unaudited)


September 30,

2020


September 30,

2019

ASSETS


Current assets:


Cash and cash equivalents

$

54,129


$

92,792


Accounts receivable, net

59,227


56,417


Inventories

51,568


39,764


Other current assets

5,134


3,574


Total current assets

170,058


192,547


Other non-current assets

358,624


206,151


Total assets

$

528,682


$

398,698


LIABILITIES AND STOCKHOLDERS’ EQUITY


Current liabilities:


Accounts payable

$

28,067


$

21,183


Other current liabilities

33,163


23,275


Total current liabilities

61,230


44,458


Other non-current liabilities

95,952


5,262


Total liabilities

157,182


49,720


Total stockholders’ equity

371,500


348,978


Total liabilities and stockholders’ equity

$

528,682


$

398,698


Digi International Inc.

Condensed Consolidated Statements of Cash Flows

(In thousands)

(Unaudited)


Fiscal year ended September 30,


2020


2019

Net cash provided by operating activities

$

34,478


$

28,964


Net cash (used in) provided by investing activities

(136,997

)


5,511


Net cash provided by financing activities

63,603


1,113


Effect of exchange rate changes on cash and cash equivalents

253


(810

)

Net (decrease) increase in cash and cash equivalents

(38,663

)


34,778


Cash and cash equivalents, beginning of period

92,792


58,014


Cash and cash equivalents, end of period

$

54,129


$

92,792


Non-GAAP Financial Measures

TABLE 1

Reconciliation of Net Income to Adjusted EBITDA

(In thousands)


Three months ended September 30,


Fiscal year ended September 30,


2020


2019


2020


2019


% of total

revenue


% of total

revenue


% of total

revenue


% of total

revenue

Total revenue

$

73,169


100.0

%


$

64,960


100.0

%


$

279,271


100.0

%


$

254,203


100.0

%


Net income

$

4,433


$

2,286


$

8,411


$

9,958


Interest expense (income), net

525


(168

)


3,288


(631

)


Income tax (benefit) expense

(89

)


301


(948

)


1,187


Depreciation and amortization

5,140


3,384


19,299


13,396


Stock-based compensation

1,914


1,475


7,237


5,655


Gain on sale of building


(4,396

)


Restructuring (reversal) charge

(12

)


117


(87

)


Acquisition expense

154


345


2,772


1,390


Adjusted EBITDA

$

12,065


16.5

%


$

7,623


11.7

%


$

40,176


14.4

%


$

26,472


10.4

%

TABLE 2

Reconciliation of Net Income and Net Income per Diluted Share to

Adjusted Net Income and Adjusted Net Income per Diluted Share

(In thousands, except per share amounts)


Three months ended September 30,


Fiscal year ended September 30,


2020


2019


2020


2019

Net income and net income per diluted share

$

4,433


$

0.15


$

2,286


$

0.08


$

8,411


$

0.28


$

9,958


$

0.35


Amortization

4,067


0.14


2,149


0.07


14,754


0.50


8,818


0.31


Stock-based compensation

1,914


0.06


1,475


0.05


7,237


0.24


5,655


0.20


Other non-operating expense (income)

352


0.01


(311

)


(0.01

)


566


0.02


(442

)


(0.02

)

Acquisition expense

154


0.01


345


0.01


2,772


0.09


1,390


0.05


Acquisition earn-out adjustments


3


(128

)


1,191


0.04


Restructuring (reversal) charge

(12

)


117


(87

)


Interest expense related to acquisition

526


0.02


3,558


0.12


Gain on sale of building


(4,396

)


(0.15

)

Tax effect from the above adjustments (1)

(1,715

)


(0.06

)


(858

)


(0.03

)


(7,106

)


(0.24

)


(2,565

)


(0.09

)

Discrete tax (benefits) expense (2)

(89

)


31


(1,216

)


(0.04

)


(549

)


(0.02

)

Adjusted net income and adjusted net income per diluted share (3)

$

9,630


$

0.32


$

5,120


$

0.18


$

28,965


$

0.98


$

18,973


$

0.66


Diluted weighted average common shares


29,678


28,916


29,546


28,554


(1)

The tax effect from the above adjustments assumes an estimated effective tax rate of 20.2% for fiscal 2020 and 18% for fiscal 2019 based on adjusted net income.

(2)

For the three months ended September 30, 2020, discrete tax benefits primarily are a result of expiring statute of limitations. For the twelve months ended September 30, 2020, discrete tax benefits include excess tax benefits recognized on stock compensation, an adjustment of our state deferred tax rate due to the Opengear acquisition and expiring statute of limitations. For the three and twelve months ended September 30, 2019, discrete tax benefits primarily includes reversals of tax reserves due to the expiration of statutes of limitation.

(3)

Adjusted net income per diluted share may not add due to the use of rounded numbers.


Investor Contact:

James J. Loch

Senior Vice President, Chief Financial Officer and Treasurer

Digi International

952-912-3737

Email: [email protected]

KEYWORDS: Minnesota United States North America

INDUSTRY KEYWORDS: Data Management Technology Mobile/Wireless Software Networks Internet Hardware

MEDIA:

Logo
Logo

Aziyo Biologics Awarded Breakthrough Technology Contract with Premier Inc.

SILVER SPRING, Md., Nov. 12, 2020 (GLOBE NEWSWIRE) — Aziyo Biologics, Inc. (“Aziyo”), a commercial-stage regenerative medicine company focused on creating the next generation of differentiated products and improving outcomes in patients undergoing surgery, has been awarded a group purchasing agreement with Premier Inc., for Premier’s Technology Breakthroughs Program. Effective December 1, 2020, the new agreement allows Premier members, at their discretion, to take advantage of special pricing and terms pre-negotiated by Premier for Aziyo’s CanGaroo® Envelope – a 510(k) FDA-cleared and CE-Marked extracellular matrix (ECM) envelope intended to securely hold a cardiac implantable electronic device (CIED) or an implantable neurostimulator to create a stable environment when implanted in the body.

“We are honored to be recognized by Premier as a Breakthrough Technology and are excited to make CanGaroo available to their members to address implantable electronic device complications,” said Ron Lloyd, President and CEO. “This contract recognizes the innovative regenerative medicine technology we have developed to help physicians better manage and potentially avoid complications for patients undergoing these procedures. We are looking forward to this next step in our broader commercialization efforts and getting CanGaroo into the hands of a wider range of customers.”

Premier is a leading healthcare improvement company, uniting an alliance of approximately 4,100 U.S. hospitals and 200,000 other providers to transform healthcare. With integrated data and analytics, collaboratives, supply chain solutions, and advisory and other services, Premier enables better care and outcomes at a lower cost.

About
the
CanGaroo

® Envelope


The CanGaroo Envelope is a small intestine submucosa (SIS) extracellular matrix (ECM) designed to mitigate complications deriving from implantable electronic devices and the shortcomings of synthetic envelopes. Once implanted, it creates a hospitable environment for the surrounding cells to migrate into the bio scaffold and start matrix turnover. The natural, systemically vascularized pocket is remodeled into a surrounding layer of vital, vascularized tissue, potentially reducing the risk of capsular formation, migration and erosion of the implantable device through the skin, and complications associated with Twiddler’s syndrome. The CanGaroo Envelope may also facilitate the process of implantation and of device removal during its replacement, as well as enhance patient comfort.

About
Aziyo Biologics

Aziyo Biologics is a commercial-stage regenerative medicine company focused on creating the next generation of differentiated products and improving outcomes in patients undergoing surgery, concentrating on patients receiving implantable medical devices. Since its founding in 2015, the Company has created a portfolio of commercial-stage products used in cardiovascular, orthopedic, and reconstructive specialties. For more information, visit www.Aziyo.com.        

Media
:

Courtney Guyer
Aziyo Biologics, Inc.
[email protected]

Investor
s
:

Leigh Salvo or Caroline Paul
Gilmartin Group
[email protected]

Ruth’s Hospitality Group, Inc. Announces CFO Transition

Ruth’s Hospitality Group, Inc. Announces CFO Transition

Kristy Chipman’s Appointment Effective November 30, 2020

WINTER PARK, Fla.–(BUSINESS WIRE)–
Ruth’s Hospitality Group, Inc. (Nasdaq: RUTH) today announced that Kristy Chipman has been appointed Chief Financial Officer, effective November 30, 2020. Ms. Chipman will succeed Arne Haak, who will be stepping down from the role. Mr. Haak will remain with Ruth’s Hospitality Group as a strategic advisor through early 2021 to facilitate a seamless transition.

Cheryl Henry, President and Chief Executive Officer of Ruth’s Hospitality Group, Inc., stated, “Throughout her extensive career, Kristy has demonstrated strong financial leadership through a combination of strategic finance, development, and corporate financial planning and analysis experience. We are thrilled to have her join the Ruth’s team and look forward to benefiting from her well-established credentials and executive leadership abilities.”

Henry continued, “We would also like to thank Arne for his contributions to Ruth’s over the past nine years. He has played an important role in the execution of our total return strategy, which will continue to be the cornerstone of our strategic efforts going forward. We are appreciative of his support during the transition period and we wish him well in his future endeavors.”

Arne Haak added, “I’m incredibly proud of what we’ve accomplished at Ruth’s Chris over the last 9 years. We’ve smartly expanded our portfolio of restaurants and built a culture of excellence throughout the organization. I would like to thank Cheryl, the Board of Directors, the Senior Leadership Team, and my team, as well as all of our franchisees and operating team members. Ruth’s Chris is an incredible business, and I am very optimistic about the future of the Company.”

Kristy Chipman is a well-rounded finance leader with over 25 years of experience in best-in-class consumer and publicly-traded restaurant companies. Previously, Ms. Chipman served as Chief Financial Officer for Orangetheory Fitness, where she led the finance and accounting team of the high-growth global fitness franchise with over 1,300 studios located throughout the US and internationally. Before joining Orangetheory, she was the Vice President of Finance and Treasurer at Domino’s Pizza, Inc., where she developed a three-year roadmap for the finance team as well as successfully redesigned the Company’s international finance structure. Prior to Domino’s, she held various finance leadership positions at McDonald’s Corporation, most recently as a Senior Director, Corporate Controller Group. During her tenure, she was responsible for developing plan targets for income, capital and G&A, and providing analysis to top management on business strategies.

Ms. Chipman received her B.A. degree in Accounting from Illinois Wesleyan University in Bloomington, IL, and her M.B.A. (with focused coursework in Marketing and Finance) from the Kellstadt Graduate School of Business at DePaul University in Chicago, IL. She is a Certified Public Accountant licensed by the state of Illinois.

About Ruth’s Hospitality Group

Ruth’s Hospitality Group, Inc., headquartered in Winter Park, Florida, is the largest fine dining steakhouse company in the U.S. as measured by the total number of Company-owned and franchisee-owned restaurants, with over 140 Ruth’s Chris Steak House locations worldwide specializing in USDA Prime grade steaks served in Ruth’s Chris’ signature fashion – “sizzling.”

For information about our restaurants or to purchase gift cards, please visit www.RuthsChris.com. For more information about Ruth’s Hospitality Group, Inc., please visit www.rhgi.com.

Investor Relations Contact

Fitzhugh Taylor

Email: [email protected]

KEYWORDS: Florida Illinois United States North America

INDUSTRY KEYWORDS: Retail Other Professional Services Health Entertainment Finance Other Health Accounting Restaurant/Bar General Entertainment Professional Services Other Retail Other Entertainment Fitness & Nutrition Food/Beverage

MEDIA: