Better Announces First Conversational Credit Decision Engine in ChatGPT with OpenAI
With AI speed, mortgage and home equity loans can be approved in as little as 47 seconds saving lenders 21 days on average
NEW YORK–(BUSINESS WIRE)–
Better.com (NASDAQ: BETR), the leading AI-native home finance platform today announced the launch of the first conversational credit decision engine for mortgages and home equity loans in ChatGPT with OpenAI. With the new app, users can connect to Better’s Tinman® engine directly in ChatGPT for decision-ready information, so lending teams can confidently approve more loans faster and pass savings back to borrowers.
This press release features multimedia. View the full release here: https://www.businesswire.com/news/home/20260305512251/en/
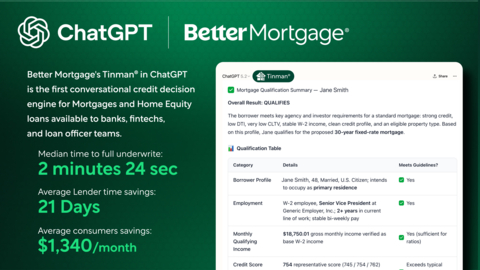
Through this launch, Better expands Tinman AI Platform access to the entire financial services industry using ChatGPT through a custom Model Context Protocol (MCP) connector built by Better’s engineering and AI teams in collaboration with OpenAI.
“The mortgage industry is riddled with inefficiencies that hurt consumers, as well as the loan officers and lenders who serve them. Big mortgage aggregators in the broker and correspondent channel charge what is essentially a 1-2% tax on each loan just to underwrite a mortgage and deliver it to an institutional investor. That ends now,” said Leah Price, General Manager of Tinman AI Platform. “Loan officer teams and banks can simply log into their ChatGPT Enterprise account, download the Tinman AI credit decision engine app, connect their guidelines, pricing, and CRM to process, underwrite, and fulfill loans nearly instantly; passing thousands of dollars in savings to consumers. We’ve put the full power of Tinman inside ChatGPT, a platform more than 100 million Americans already know and trust. This is a total game changer.”
The MCP serves as the delivery layer, but real-time context is the true differentiator. The Tinman AI Platform maintains a real-time snapshot across every loan file at any given moment: facts, documents, actions, and any work needed to complete a file. The platform’s context engineering composes the exact context per request, and an underwriting orchestrator drives specialized agents to read docs, apply guidelines, and return a decision-ready status supported by a crisp, granular decision tree — capabilities that legacy LOS stacks are unable to replicate. This gives enterprise clients; mortgage companies, fintechs, and loan officer teams instant access to underwrite loans, powered by the industry’s richest context graph and learning data store.
Tinman is built on over a decade of institutional mortgage intelligence powering its machine learning engine and context graph. The platform has mapped individual mortgage processing and underwriting roles, with tasks, actions, rules, and decisions on more than $110 billion in funded loans, over 12 million recorded customer calls, and over 5 billions of pages of credit, income, home and asset level documentation, matched with the underwriting criteria and pricing parameters of over 45 different institutional buyers of mortgage and home equity loans totaling over 80% of the US mortgage market.
“We’re thrilled about our collaboration with OpenAI and the launch of the Tinman AI app in ChatGPT. We have full intention to continue building additional tools on OpenAI that will revolutionize the mortgage and home equity industry together. By reducing the time and cost to originate, we can dramatically lower rates for consumers and make mortgages more affordable for more American families. We’re just getting started,” said Vishal Garg, Founder & CEO of Better.
Tony Song, a Better Loan Officer ranked Top 100 in Dollar Volume, Purchase Volume, and Most Loans Closed by Scotsman Guide said, “The most important part of my day is delivering mortgage purchase commitment letters to homebuyers that need a mortgage to buy a home. With this launch, I’m already benefitting from the efficiencies, and I will be able to serve 10x more customers daily compared to what was possible with the traditional mortgage underwriting process.”
Loan officers using the Tinman AI app are able to take consumer application data and documents to fully underwrite a mortgage loan to the exact underwriting guidelines across the full product set and buy box of over 45 institutional mortgage investors including Fannie Mae, Freddie Mac, FHA, as well as major banks such as J.P. Morgan Chase, Truist, Citizens Bank, US Bank, Huntington Bank, and Fifth Third in as little as 47 seconds and a median of 2 minutes and 24 seconds compared to the average of 21 days for the traditional mortgage industry.
This launch expands Better’s collaboration with OpenAI, building on the company’s enterprise-wide deployment of ChatGPT across its 1,400 employees and its use of OpenAI’s multimodal models to power Betsy™, Better’s AI loan agent for consumer and enterprise customers.
“Better is embedding AI at the core of its business, helping its employees and lenders move faster from data to decision,” said Giancarlo “GC” Lionetti, Chief Commercial Officer at OpenAI. “With OpenAI, Better is not only advancing mortgage intelligence for the industry but also demonstrating how AI can transform how financial institutions operate from the inside out.”
We encourage you to watch the Tinman AI Credit Decision App demo: https://better.com/tinman. If you have ever gotten a mortgage as a consumer or work in the mortgage industry, it will change the way you think about home finance.
About Better Home & Finance Holding Company
Better Home & Finance Holding Company (NASDAQ: BETR) is the first AI-native mortgage and home equity finance platform, and first fintech to fund more than $110 billion in loan volume. Better has leveraged its industry-leading AI platform, Tinman®, to achieve its singular mission of making homeownership cheaper, faster, and easier for all Americans. Tinman® allows customers to see their rate options in seconds, get pre-approved in minutes, lock in rates, and close their loan in as little as three weeks. In addition, Betsy™, the first AI loan agent built exclusively for the mortgage industry, revolutionizes the homebuying journey by answering questions, delivering approvals, comparing products, processing rate locks, and moving their loan application along to closing 24/7/365. Better’s mortgage offerings include GSE-conforming mortgage loans, FHA and VA loans, and jumbo mortgage and home equity loans. Better serves customers in all 50 US states and the United Kingdom.
For more information, follow @tinmanAI on X and @betterdotcom on Instagram and TikTok.
View source version on businesswire.com: https://www.businesswire.com/news/home/20260305512251/en/
KEYWORDS: New York United States North America
INDUSTRY KEYWORDS: Apps/Applications Technology Finance Fintech Banking Other Technology Professional Services Software Artificial Intelligence Other Professional Services
MEDIA:
| Photo |
 |
| Photo |
 |
| Decision-ready information so lending teams can confidently approve more loans, faster. |
| Logo |