Apple lands record-breaking 81 Emmy Award nominations with “Severance” leading as this year’s most-nominated series and “The Studio” becoming the most-nominated freshman comedy in history
Global phenomenon “Severance” scores 27 nominations for hit second season, including Outstanding Drama Series, and nine performance category nominations
Breakout comedy “The Studio” sweeps with 23 nominations including Outstanding Comedy Series, making history with the most nominations for a freshman comedy and most overall acting nominations this year
Apple TV+ leads as the only network to land multiple title nominations across Outstanding Comedy and Drama series categories as “The Studio,” “Severance,” “Slow Horses” and “Shrinking” land top program nominations, alongside Apple’s first-ever Outstanding Television Movie nod for “The Gorge”
Apple also lands the most acting nominations of any network or studio this year, with 31 performance nods total
Apple Originals honored with nominations across 14 titles, including “Severance,” “The Studio,” “Slow Horses,” “Shrinking,” “Presumed Innocent,” “The Gorge,” “Bad Sisters,” “Dope Thief,” “Disclaimer,” “Pachinko,” “Your Friends & Neighbors,” “Dark Matter,” “Deaf President Now!” and “Bono: Stories of Surrender”
CULVER CITY, Calif.–(BUSINESS WIRE)–
Apple TV+ earns a record-breaking 81 Emmy Award nominations across 14 hit Apple Original titles for this year’s 77th Emmy Awards, as “Severance” becomes this year’s most-nominated series with 27 nominations, and “The Studio” makes history as the most-nominated freshman comedy series with 23 nominations in total. Additionally, with top program nominations for drama “Slow Horses” and comedy “Shrinking,” Apple TV+ becomes the only network to have multiple titles nominated in the Outstanding Comedy and Drama series categories. Apple also lands the most acting nominations of any network or studio this year, with 31 performance nods total.
This press release features multimedia. View the full release here: https://www.businesswire.com/news/home/20250715987568/en/
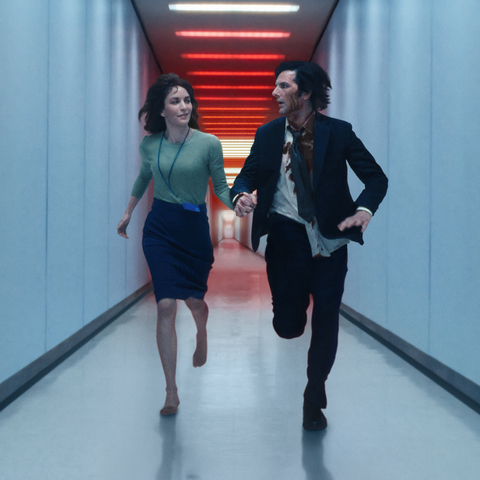
Apple TV+’s global hit “Severance” becomes this year’s most-Emmy nominated series with 27 nominations in total.
“Everyone at Apple is celebrating the talent, creativity and hard work of all of our Emmy nominees this morning,” said Zack Van Amburg, Apple’s head of Worldwide Video. “‘Severance’ and ‘The Studio’ have exceeded our wildest expectations in earning the most nominations for both drama and comedy series, alongside the phenomenal ‘Shrinking’ and ‘Slow Horses.’ These shows have connected deeply with audiences around the world and we’re incredibly appreciative to the Television Academy for recognizing the breadth of storytelling that has been an honor for us to champion. We send our warmest congratulations to all of today’s nominees.”
“This record-breaking year is a milestone for Apple, and we’re especially proud of the continued impact our outstanding series nominees— ‘Severance,’ ‘The Studio,’ ‘Shrinking,’ and ‘Slow Horses’ — are having on global culture,” said Jamie Erlicht, Apple’s Head of Worldwide Video. “These nominations honor bold storytelling, exceptional performances, and remarkable craftsmanship, and we’re deeply grateful to the Television Academy for recognizing these visionary creators.”
“Severance” dominates as the most-nominated series this year, with 27 overall nominations including Outstanding Drama, Outstanding Lead Actor Adam Scott and Lead Actress Britt Lower, Outstanding Directing for Ben Stiller and Jessica Lee Gagné, Outstanding Writing for Dan Erickson, alongside recognition for Outstanding performances by Zach Cherry, Tramell Tillman, John Turturro, Patricia Arquette, Jane Alexander, Gwendoline Christie and Merritt Wever, as well as nods across several craft categories.
As the most-nominated freshman comedy series in history, in addition to Outstanding Comedy, “The Studio” scores Outstanding Lead Actor, Directing and Writing for Seth Rogen, Outstanding Supporting Actor Ike Barinholtz, Supporting Actress Kathryn Hahn and Catherine O’Hara, as well as five of the six nominations in the Outstanding Guest Actor category, including first-ever acting nominations for directors Martin Scorsese and Ron Howard, alongside Bryan Cranston, Dave Franco and Anthony Mackie, with Guest Actress Zoë Kravitz.
In its sophomore season, Apple’s beloved “Shrinking” nabs its first-ever nomination for Outstanding Comedy Series and Harrison Ford is recognized with his first Emmy Award nomination for his celebrated performance in the series. Jason Segel nabs Outstanding Lead Actor in a Comedy, alongside Outstanding Supporting Actor Michael Urie and Supporting Actress Jessica Williams.
Following last year’s Emmy Award win for Outstanding Writing for a Drama Series, “Slow Horses” lands nominations for Outstanding Drama, plus Outstanding Lead Actor for Sir Gary Oldman, Outstanding Directing for Adam Randall, Outstanding Casting and Outstanding Writing for a Drama Series for Will Smith.
Apple Original Films’ “The Gorge” lands the first Outstanding Television Movie nomination for Apple TV+, as Apple Original documentaries “Deaf President Now!” and “Bono: Stories of Surrender” are also recognized.
Apple TV+ series stars lead with the most performance nominations overall, earning 31 acting category nominations, including ten top acting nominations for acclaimed performances in “The Studio,” nine nominations for the stars and guest stars of “Severance,” and four nominations for performances in “Shrinking” and “Presumed Innocent,” respectively. “Dope Thief” star Brian Tyree Henry also scores a nomination for Outstanding Lead Actor in a Limited or Anthology Series or Movie for “Dope Thief,” as Sir Gary Oldman lands his second nomination for Outstanding Lead Actor in a Drama Series for “Slow Horses” and Sharon Horgan is recognized with her second nomination for Outstanding Lead Actress in a Drama Series for the BAFTA Award-winning ”Bad Sisters.”
The nominations were announced today by the Television Academy, and the winners will be unveiled at the Creative Arts ceremonies on September 6 and 7, and the Primetime Emmy Awards ceremony on September 14, 2025.
To date, Apple Original films, documentaries and series have earned 580 wins and 2,761 award nominations and counting, including multi-Emmy Award-winning comedy “Ted Lasso” and historic Oscar Best Picture winner “CODA.”
In total, Apple scores 81 Emmy Award nominations, including:
“Severance” (27)
-
Outstanding Drama Series
-
Outstanding Lead Actor in a Drama Series: Adam Scott
-
Outstanding Lead Actress in a Drama Series: Britt Lower
-
Outstanding Supporting Actor in a Drama Series: Zach Cherry
-
Outstanding Supporting Actor in a Drama Series: Tramell Tillman
-
Outstanding Supporting Actor in a Drama Series: John Turturro
-
Outstanding Supporting Actress in a Drama Series: Patricia Arquette
-
Outstanding Guest Actress in a Drama Series: Jane Alexander
-
Outstanding Guest Actress in a Drama Series: Gwendoline Christie
-
Outstanding Guest Actress in a Drama Series: Merritt Wever
-
Outstanding Directing for a Drama Series: Jessica Lee Gagné
-
Outstanding Directing for a Drama Series: Ben Stiller
-
Outstanding Writing for a Drama Series: Dan Erickson
-
Outstanding Production Design for a Narrative Contemporary Program (One Hour or More)
-
Outstanding Music Composition for a Series (Original Dramatic Score)
-
Outstanding Casting For A Drama Series
-
Outstanding Choreography For Scripted Programming
-
Outstanding Cinematography For A Series (One Hour)
-
Outstanding Picture Editing For A Drama Series (X3)
-
Outstanding Title Design
-
Outstanding Music Supervision
-
Outstanding Sound Editing For A Comedy Or Drama Series (One Hour)
-
Outstanding Sound Mixing For A Comedy Or Drama Series (One Hour)
-
Outstanding Special Visual Effects In A Single Episode
-
Outstanding Stunt Performance
“The Studio” (23)
-
Outstanding Comedy Series
-
Outstanding Lead Actor in a Comedy Series: Seth Rogen
-
Outstanding Supporting Actor in a Comedy Series: Ike Barinholtz
-
Outstanding Supporting Actress in a Comedy Series: Kathryn Hahn
-
Outstanding Supporting Actress in a Comedy Series: Catherine O’Hara
-
Outstanding Guest Actor in a Comedy Series: Bryan Cranston
-
Outstanding Guest Actor in a Comedy Series: Dave Franco
-
Outstanding Guest Actor in a Comedy Series: Ron Howard
-
Outstanding Guest Actor in a Comedy Series: Anthony Mackie
-
Outstanding Guest Actor in a Comedy Series: Martin Scorsese
-
Outstanding Guest Actress in a Comedy Series: Zoë Kravitz
-
Outstanding Directing for a Comedy Series: Seth Rogen, Evan Goldberg
-
Outstanding Writing for a Comedy Series: Seth Rogen, Evan Goldberg, Peter Heck, Alex Gregory, Frida Perez
-
Outstanding Production Design for a Narrative Program (Half-Hour)
-
Outstanding Casting For A Comedy Series
-
Outstanding Cinematography For A Series (Half-Hour)
-
Outstanding Contemporary Costumes For A Series
-
Outstanding Picture Editing For A Single Camera Comedy Series
-
Outstanding Contemporary Hairstyling
-
Outstanding Music Composition for a Series (Original Dramatic Score)
-
Outstanding Music Supervision
-
Outstanding Sound Editing For A Comedy Or Drama Series (Half-Hour)
-
Outstanding Sound Mixing For A Comedy Or Drama Series (Half-Hour) And Animation
“Shrinking” (7)
-
Outstanding Comedy Series
-
Outstanding Lead Actor in a Comedy Series: Jason Segel
-
Outstanding Supporting Actor in a Comedy Series: Harrison Ford
-
Outstanding Supporting Actor in a Comedy Series: Michael Urie
-
Outstanding Supporting Actress in a Comedy Series: Jessica Williams
-
Outstanding Casting For A Comedy Series
-
Outstanding Sound Mixing For A Comedy Or Drama Series (Half-Hour) And Animation
“Slow Horses” (5)
-
Outstanding Drama Series
-
Outstanding Lead Actor in a Drama Series: Gary Oldman
-
Outstanding Writing for a Drama Series: Will Smith
-
Outstanding Directing for a Drama Series: Adam Randall
-
Outstanding Casting For A Drama Series
“Presumed Innocent” (4)
-
Outstanding Lead Actor in a Limited or Anthology Series or Movie: Jake Gyllenhaal
-
Outstanding Supporting Actor in a Limited or Anthology Series or Movie: Bill Camp
-
Outstanding Supporting Actor in a Limited or Anthology Series or Movie: Peter Sarsgaard
-
Outstanding Supporting Actress in a Limited or Anthology Series or Movie: Ruth Negga
“Disclaimer” (2)
-
Outstanding Lead Actress in a Limited or Anthology Series or Movie: Cate Blanchett
-
Outstanding Cinematography For A Limited Or Anthology Series or Movie
“Bad Sisters” (1)
-
Outstanding Lead Actress in a Drama Series: Sharon Horgan
“Dope Thief” (1)
-
Outstanding Lead Actor in a Limited Series: Brian Tyree Henry
“The Gorge” (2)
-
Outstanding Television Movie
-
Outstanding Sound Editing For A Limited Or Anthology Series, Movie Or Special
“Deaf President Now!” (2)
-
Outstanding Documentary or Nonfiction Special
-
Outstanding Directing For A Documentary/Nonfiction Program: Nyle DiMarco, Davis Guggenheim
“Pachinko” (2)
-
Outstanding Production Design for a Narrative Period or Fantasy Program (One Hour or More)
-
Outstanding Cinematography For A Series (One Hour)
“Your Friends & Neighbors” (1)
-
Outstanding Original Main Title Theme Music
“Bono: Stories of Surrender” (1)
-
Outstanding Technical Direction and Camerawork For A Special
“Dark Matter” (1)
Nominees for Outstanding Commercial (2)
-
Heartstrings – Apple AirPods Pro
-
Flock – Apple Privacy
“Severance”
In “Severance,” Mark Scout (Adam Scott) leads a team at Lumon Industries, whose employees have undergone a severance procedure that surgically divides their memories between their work and personal lives. This daring experiment in “work-life balance” is called into question as Mark finds himself at the center of an unraveling mystery that will force him to confront the true nature of his work … and of himself. In season two, Mark and his friends learn the dire consequences of trifling with the severance barrier, leading them further down a path of woe.
“The Studio”
In “The Studio,” Seth Rogen stars as Matt Remick, the newly appointed head of embattled Continental Studios. As movies struggle to stay alive and relevant, Matt and his core team of infighting executives battle their insecurities as they wrangle narcissistic artists and craven corporate overlords in the ever-elusive pursuit of making great films. With their power suits masking their never-ending sense of panic, every party, set visit, casting decision, marketing meeting and award show presents them with an opportunity for glittering success or career-ending catastrophe. As someone who eats, sleeps and breathes movies, it’s the job Matt’s been pursuing his whole life, and it may very well destroy him.
“Shrinking”
“Shrinking” follows a grieving therapist who starts to break the rules and tell his clients exactly what he thinks. Ignoring his training and ethics, he finds himself making huge, tumultuous changes to people’s lives … including his own.
“Slow Horses”
This darkly funny espionage drama follows a team of British intelligence agents who serve in a dumping ground department of MI5 due to their career-ending mistakes. Led by their brilliant but irascible leader, the notorious Jackson Lamb (Academy Award winner Sir Gary Oldman), they navigate the espionage world’s smoke and mirrors to defend England from sinister forces.
“Presumed Innocent”
“Presumed Innocent” is an eight-episode limited series starring and executive produced by Jake Gyllenhaal, hailing from David E. Kelley and executive producer J.J. Abrams and based on the New York Times bestselling novel of the same name by Scott Turow. Starring Gyllenhaal in the lead role of chief deputy prosecutor Rusty Sabich, the series takes viewers on a gripping journey through the horrific murder that upends the Chicago Prosecuting Attorney’s office when one of its own is suspected of the crime. The series explores obsession, sex, politics, and the power and limits of love, as the accused fights to hold his family and marriage together. The star-studded ensemble cast of the thriller also includes Ruth Negga, Bill Camp, Elizabeth Marvel, Peter Sarsgaard, O-T Fagbenle and Renate Reinsve.
“Disclaimer”
“Disclaimer” is a gripping psychological thriller in seven chapters, starring Academy Award winners Cate Blanchett and Kevin Kline. Written and directed by five-time Academy Award winner Alfonso Cuarón, “Disclaimer” is based on the bestselling novel of the same name by Renée Knight. Acclaimed journalist Catherine Ravenscroft (Blanchett) built her reputation revealing the misdeeds and transgressions of others. When she receives a novel from an unknown author, she is horrified to realize she is now the main character in a story that exposes her darkest secrets.
As Catherine races to uncover the writer’s true identity, she is forced to confront her past before it destroys her life and her relationships with her husband Robert (Sacha Baron Cohen) and their son Nicholas (Kodi Smit-McPhee). The ensemble cast includes Lesley Manville, Louis Partridge, Leila George and Hoyeon, and features Indira Varma as the narrator.
“Bad Sisters”
“Bad Sisters” season two returns to follow the lives of the Garvey sisters played by Sharon Horgan as Eva, Anne-Marie Duff as Grace, Eva Birthistle as Ursula, Sarah Greene as Bibi and Eve Hewson as Becka. Two years after the “accidental death” of Grace’s abusive husband, the close-knit Garvey sisters may have moved on, but when past truths resurface, the ladies are thrust back into the spotlight, suspicions are at an all-time high, lies are told, secrets revealed and the sisters are forced to work out who they can trust.
“Dope Thief”
Based on Dennis Tafoya’s book “Dope Thief,” the series follows long-time Philly friends and delinquents who pose as DEA agents to rob an unknown house in the countryside, only to have their small-time grift become a life-and-death enterprise, as they unwittingly reveal and unravel the biggest hidden narcotics corridor on the Eastern Seaboard.
“The Gorge”
Two highly-trained operatives (Miles Teller and Anya Taylor-Joy) are appointed to posts in guard towers on opposite sides of a vast and highly classified gorge, protecting the world from an undisclosed, mysterious evil that lurks within. They bond from a distance while trying to stay vigilant in defending against an unseen enemy. When the cataclysmic threat to humanity is revealed to them, they must work together in a test of both their physical and mental strength to keep the secret in the gorge before it’s too late.
“Pachinko”
Epic in scope and intimate in tone, the story begins with a forbidden love and crescendos into a sweeping saga that journeys between Korea, Japan and America to tell an unforgettable story of war and peace, love and loss, triumph and reckoning.
“Your Friends & Neighbors”
After being fired in disgrace, a hedge fund manager still grappling with his recent divorce, resorts to stealing from his neighbors’ homes in the exceedingly affluent Westmont Village, only to discover that the secrets and affairs hidden behind those wealthy facades might be more dangerous than he ever imagined.
“Deaf President Now!”
The story of the greatest civil rights movement most people have never heard of. “Deaf President Now!” recounts the eight days of historic protests held at Gallaudet University in 1988 after the school’s board of trustees appointed a hearing president over several very qualified Deaf candidates. After a week of rallies, boycotts and protests, the students of Gallaudet University triumph as the hearing president resigns and beloved dean Dr. I. King Jordan becomes the university’s first Deaf president. The protests marked a pivotal moment in civil rights history, with an impact that extended well beyond the Gallaudet campus, and paved the way for the Americans with Disabilities Act (ADA). “Deaf President Now!” features exclusive interviews with the five key figures of the movement, including the DPN4 — Jerry Covell, Bridgetta Bourne-Firl, Tim Rarus and Greg Hlibok — alongside I. King Jordan, as well as archival and scripted elements. The film also incorporates an experimental narrative approach called Deaf Point of View, using impressionistic visual photography and intricate sound design to thrust the audience into the Deaf experience.
“Bono: Stories of Surrender”
“Bono: Stories of Surrender” is a vivid reimagining of Bono’s critically acclaimed one-man stage show, “Stories of Surrender: An Evening of Words, Music and Some Mischief…” As he pulls back the curtain on a remarkable life and the family, friends and faith that have challenged and sustained him, he also reveals personal stories about his journey as a son, father, husband, activist and rock star. Along with never-before-seen, exclusive footage from the tour, the film features Bono performing many of the iconic U2 songs that have shaped his life and legacy.
“Dark Matter”
Hailed as one of the best sci-fi novels of the decade, “Dark Matter” is a story about the road not taken. The series will follow Jason Dessen (played by Joel Edgerton), a physicist, professor and family man who — one night while walking home on the streets of Chicago — is abducted into an alternate version of his life. Wonder quickly turns to nightmare when he tries to return to his reality amid the mind-bending landscape of lives he could have lived. In this labyrinth of realities, he embarks on a harrowing journey to get back to his true family and save them from the most terrifying, unbeatable foe imaginable: himself.
All programs are currently streaming on Apple TV+.
Apple TV+ offers premium, compelling drama and comedy series, feature films, groundbreaking documentaries, and kids and family entertainment, and is available to watch across all your favorite screens. After its launch on November 1, 2019, Apple TV+ became the first all-original streaming service to launch around the world, and has premiered more original hits and received more award recognitions faster than any other streaming service in its debut.
About Apple TV+
Apple TV+ is available on the Apple TV app in over 100 countries and regions, on over 1 billion screens, including iPhone, iPad, Apple TV, Apple Vision Pro, Mac, popular smart TVs from Samsung, LG, Sony, VIZIO, TCL and others, Roku and Amazon Fire TV devices, Chromecast with Google TV, PlayStation and Xbox gaming consoles, and at tv.apple.com, for $9.99 per month with a seven-day free trial for new subscribers. For a limited time, customers who purchase and activate a new iPhone, iPad, Apple TV, Mac or iPod touch can enjoy three months of Apple TV+ for free.*
For more information, visit apple.com/tvpr and see the full list of supported devices.
*Special offer is good for three months after the first activation of the eligible device. One offer per Family Sharing group. Plans automatically renew until cancelled. Other restrictions and terms apply; visit apple.com/promo for more information.

View source version on businesswire.com: https://www.businesswire.com/news/home/20250715987568/en/
[email protected]
KEYWORDS: United States North America California
INDUSTRY KEYWORDS: Film & Motion Pictures TV and Radio Consumer Electronics General Entertainment Mobile Entertainment Technology Celebrity Entertainment
MEDIA:
| Photo |
 |
| Apple TV+’s global hit “Severance” becomes this year’s most-Emmy nominated series with 27 nominations in total. |