Eiger Announces Case Studies Demonstrating Regression of Liver Fibrosis Following 48 Weeks of Therapy with Peginterferon Lambda in Patients with Chronic Hepatitis Delta Virus (HDV) Infection Presented at The Liver Meeting Digital Experience™ 2020

PR Newswire

PALO ALTO, Calif., Nov. 16, 2020 /PRNewswire/ — Eiger BioPharmaceuticals, Inc. (Nasdaq: EIGR), focused on the development and commercialization of first-in-class therapies for serious rare and ultra-rare diseases, today announced a poster presentation of two case studies from the completed Phase 2 LIMT (Lambda Interferon MonoTherapy in HDV) trial at The Liver Meeting Digital Experience™ 2020. Peginterferon lambda (Lambda) is a first-in-class type III interferon in development for hepatitis delta virus (HDV) infection, the most severe form of human viral hepatitis. 

The LIMT study enrolled a total of 33 patients with chronic HDV, randomized to monotherapy Lambda 180 μg (N=14) or Lambda 120 μg (N=19), weekly subcutaneous injections for 48 weeks (EOT) with 24 weeks of follow-up (EOFU).  Recently, administration of Lambda for 48 weeks was shown to induce a durable virologic response (HDV RNA below limit of quantification at 24 weeks post-treatment) in 36% of patients with HDV and compensated liver disease.  Impact of Lambda therapy on liver histology was not assessed in the LIMT study.

Two patients who had liver biopsies prior to participation (pre-treatment) in the LIMT study, were re-biopsied 18 months after the last Lambda injection (post-treatment).  Liver biopsies were staged according to the ISHAK scoring system, ranging from F0 (no fibrosis) to F6 (cirrhosis) and evaluated.  

  • Patient 1: a 64-year-old male, HDV RNA level was 3.7 log10 at baseline, became HDV RNA undetectable at Lambda EOT with rebound to 2.6 log10 at EOFU. ALT was 169 U/L, declined to 55 U/L at EOT and remained at 54 U/L at EOFU. A reduction in liver fibrosis score from F5 (incomplete cirrhosis) to F1 (mild portal fibrosis) was observed.
  • Patient 2: a 37-year-old female, HDV RNA level was 4.9 log10 at baseline, became HDV RNA undetectable at Lambda EOT with rebound to 3.6 log10 at EOFU. ALT was 159 U/L, declined to 44 U/L at EOT and peaked to 162 U/L at EOS. A reduction in liver fibrosis score from F4 (marked bridging fibrosis) to F1 (mild portal fibrosis) was observed.

The most commonly reported adverse events in LIMT included mild to moderate flu-like symptoms and elevated transaminase levels which resolved post-treatment.  Patients previously treated with peginterferon alfa noted significantly less side effects on Lambda.

“This the first report demonstrating fibrosis regression following finite duration therapy with Lambda in patients with chronic HDV, the most severe form of hepatitis for which there is no approved treatment,” said Ohad Etzion, MD, LIMT Principal Investigator and Director of the Department of Gastroenterology and Liver Diseases at Soroka University Medical Center.  “These case studies suggest clinical benefit in the liver after 48 weeks of Lambda therapy.  We look forward to next steps for Lambda as it enters Phase 3 of clinical development.” 

About Peginterferon Lambda (Lambda)
Lambda is a well-characterized, late-stage, first-in-class, type III interferon (IFN) that stimulates immune responses that are critical for the development of host protection during viral infections.  Lambda targets type III IFN receptors which are distinct from the type I IFN receptors targeted by IFN alfa, resulting in activation of the same Jak-STAT signal transduction cascade.  Lambda type III receptors are highly expressed on hepatocytes with limited expression on hematopoietic and central nervous system cells, which may reduce off-target effects and improve tolerability of Lambda. 

Eiger licensed worldwide rights to Lambda from Bristol-Myers Squibb.  Eiger is developing Lambda as a monotherapy and in combination with Lonafarnib boosted with ritonavir.  Lambda is an investigational agent and not yet approved for any indication.  Eiger has received Orphan Designation by the U.S. Food and Drug Administration (FDA) and European Medicines Agency (EMA), and Fast Track and Breakthrough Therapy Designation by FDA for Lambda in HDV.

About LIMT (Lambda Monotherapy) Study
LIMT HDV enrolled a total of 33 patients with chronic HDV, randomized to monotherapy Lambda 180 μg (N=14) or Lambda 120 μg (N=19), weekly subcutaneous injections for 48 weeks with 24 weeks of follow-up.  At Week 48, LIMT study patients randomized to with Lambda 180 μg group experienced a mean decline in HDV-RNA of 2.3 log, with 7 of 14 (50%) experiencing ≥ 2 log decline and 5 of 14 (36%) patients achieving HDV-RNA below the limit of quantification (BLQ), comparable to historical peginterferon alfa.  At Week 72, a durable virologic response (DVR = HDV RNA below limit of quantitation) at 24 weeks post-treatment for Lambda 180 μg was achieved in 5 of 14 (36%).  LIMT HDV was an international study with sites in New Zealand, Israel and Pakistan.

About Hepatitis Delta Virus (HDV)
Hepatitis Delta is caused by infection with the hepatitis delta virus and leads to the most severe form of viral hepatitis.  Hepatitis delta occurs only as a co-infection in individuals harboring hepatitis B virus (HBV).  Hepatitis delta leads to more severe liver disease than HBV alone and is associated with accelerated liver fibrosis, liver cancer, and liver failure.  Approved nucleos(t)ide treatments for HBV only suppress HBV DNA, do not affect HBsAg and have no impact on HDV. 

Hepatitis delta is a disease with a significant impact on global health, which may affect up to 15-20 million people worldwide.  The prevalence of HDV varies among different parts of the world.  Globally, HDV infection is reported to be present in approximately 4.3% to 5.7% of chronic Hepatitis B carriers.

About Eiger

Eiger is a late-stage biopharmaceutical company focused on the development and commercialization of first-in-class, well-characterized drugs for serious rare and ultra-rare diseases for patients with high unmet medical needs. 

Eiger’s lead clinical programs target Hepatitis Delta Virus (HDV) infection, the most serious form of human viral hepatitis.  Eiger is developing two complementary treatments for HDV.  Lonafarnib is a first-in-class, oral prenylation inhibitor in a global Phase 3 trial.  Peginterferon lambda is a first-in-class, well-tolerated type III interferon entering Phase 3.

Eiger has filed an NDA and MAA for lonafarnib for the treatment of Hutchinson-Gilford Progeria Syndrome (HGPS or Progeria) and Progeroid Laminopathies.  FDA PDUFA date is November 20, 2020. 

For additional information about Eiger and its clinical programs, please visit www.eigerbio.com.

Note Regarding Forward-Looking Statements
This press release contains “forward-looking” statements that involve substantial risks and uncertainties.  All statements other than statements of historical facts, including statements regarding our future financial condition, timing for and outcomes of clinical results, business strategy and plans and objectives for future operations, are forward-looking statements.  These forward-looking statements include terminology such as “believe,” “will,” “may,” “estimate,” “continue,” “anticipate,” “contemplate,” “intend,” “target,” “project,” “should,” “plan,” “expect,” “predict,” “could,” “potentially” or the negative of these terms.  Forward-looking statements are our current statements regarding our intentions, beliefs, projections, outlook, analyses or current expectations concerning, among other things, our anticipating significant milestones in 2020 and 2021, the timing of our ongoing and planned clinical development, including the potential for approval of our lonafarnib product candidate in the U.S. and EU for Progeria and Progeroid Laminopathies; our progression and enrollment of our Phase 3 D-LIVR study in HDV; our ability to maintain supply of our clinical trial materials; our announcement of data from the trial of Lambda and lonafarnib boosted with ritonavir for HDV (LIFT); our plans to advance Lambda in HDV in the U.S. and EU;  our ability to transition into a commercial stage biopharmaceutical company; our ability to finance the continued advancement of our development pipeline products; and the potential for success of any of our product candidates.  These statements concern product candidates that have not yet been approved for marketing by the U.S. Food and Drug Administration (FDA).  No representation is made as to their safety or effectiveness for the purposes for which they are being investigated.

Various important factors could cause actual results or events to differ materially from the forward-looking statements that Eiger makes, including additional applicable risks and uncertainties described in the “Risk Factors” sections in the Quarterly Report on Form 10-Q for the quarter ended September 30, 2020 and Eiger’s subsequent filings with the SEC.  The forward-looking statements contained in this press release are based on information currently available to Eiger and speak only as of the date on which they are made.  Eiger does not undertake and specifically disclaims any obligation to update any forward-looking statements, whether as a result of any new information, future events, changed circumstances or otherwise.

SOURCE Eiger BioPharmaceuticals, Inc.
Investors: Ingrid Choong, PhD 
Email: [email protected] 
Phone: 1-650-619-6115

Cision View original content to download multimedia:http://www.prnewswire.com/news-releases/eiger-announces-case-studies-demonstrating-regression-of-liver-fibrosis-following-48-weeks-of-therapy-with-peginterferon-lambda-in-patients-with-chronic-hepatitis-delta-virus-hdv-infection-presented-at-the-liver-meeting-digital–301173992.html

SOURCE Eiger BioPharmaceuticals, Inc.

LiveXLive Media Announces Q2 Fiscal 2021 Results And 10th Consecutive Quarter Of Record Revenue

– Revenue Increased 52% YOY to a Record $14.6 Million in Q2 Fiscal 2021

– Contribution Margin* Increased Over 148% to a Record 29.3% in Q2 Fiscal 2021, up from 11.8% in Q2 fiscal 2020

– Q2 Fiscal 2021 GAAP Loss from Operations was ($7.1) Million, a 28% Improvement

– Adjusted Operating Loss (AOL)* from Core Operations was ($0.1) Million in Q2 Fiscal 2021, an Improvement of $2.0 Million when Compared to Q2 fiscal 2020 AOL* of ($2.1) Million

– Revenue Streams Diversified in Q2 Fiscal 2021 comprised of 53% Subscription, 39% Advertising and Sponsorship and 8% Pay-Per-View Ticketing compared to 94% Subscription and 6% Advertising in Q2 Fiscal 2020

– As Compared to Fiscal 2020, Shareholder Equity increased by $20.3 Million, Working Capital Increased by $18.5 million, and Cash Increased by $9 Million to $21.0 Million in Q2 Fiscal 2021

– Paid subscribers as of September 30, 2020 increased 21% to 936,000***

– Over the last six months, LiveXLive livestreamed 103 events featuring 1,553 artists generating content which has been viewed over 95 million times, as compared to 22 events featuring 224 artists generating content which was viewed over 60 million times for the same period a year ago

– Completed Acquisition of PodcastOne and Announced Planned Acquisition of Merchandising Company Custom Personalization Solutions – Expected to Expand and Further Diversify Revenue

– Spring Awakening, React Presents trophy property expands live business to Cancun Mexico, has over $1.3 million ticket sales, proving the demand for live music when COVID-19 ends.

PR Newswire

LOS ANGELES, Nov. 16, 2020 /PRNewswire/ — LiveXLive Media, Inc. (Nasdaq: LIVX) (“LiveXLive”), a global platform for livestream and on-demand audio, video and podcast content in music, comedy and pop culture, and owner of PodcastOneSlacker Radio, and React Presents, announced today results for its second fiscal quarter ended September 30, 2020 and record revenue and contribution margin*.

In Q2 fiscal 2021, LiveXLive posted record revenue of $14.6 million, as well as record contribution margin* of $4.3 million. The increases were driven by growth in advertising revenue, strong sponsorship, and pay-per-view (“PPV”) ticket sales and improved margin expansion across LiveXLive’s live music events platform. On a U.S. GAAP basis, LiveXLive recorded a loss from operations of ($7.1) million and a net loss of ($10.2) million. On a non-GAAP basis, Adjusted Operating Loss (“AOL”)* narrowed to ($1.4) million from ($3.7) million in Q2 2020. 

LiveXLive CEO and Chairman, Robert Ellin, commented, “Delivering the most authentic voice in music in the past 25 years, LiveXLive is a leading talent-first platform focused on connecting artists with their superfans – building long term, sustainable, valuable franchises in audio music, podcasting, OTT, pay-per-view and live streaming. Delivering our 10th consecutive quarter of record revenues, our team has built one of the most powerful social live music networks in the world to Attend, Listen, Watch, Engage, and Transact. Based on completed and planned pay-per-view events, the substantial increase in sponsorship deals, and an expected improvement in ad revenue, we expect to report our 11th consecutive quarter of record revenue for our current Q3 fiscal quarter.”


Recent and Q2 Fiscal 2021 Highlights

  • Completed the acquisition of PodcastOne and announced the planned all-stock acquisition of e-commerce merchandise company, Custom Personalization Solutions (“CPS”), which recorded approximately $19.0 million in revenue in 2019. The CPS acquisition is expected to close by the end of calendar 2020 and be immediately accretive to Adjusted Operating Income*.
  • LiveXLive’s 24-hour linear OTT streaming channel now reaches over 300 million people on Amazon Fire, Roku, Apple TV, SLING, both Samsung Smart TVs and Samsung TV Plus, Xumo, and ReachTV, Consumable TV streaming original content, artist interviews, concerts, festivals, ancillary event-related content and short-form video content from around the world.
  • ***Ended September 30, 2020 with 936,000 paid subscribers, an increase of 161,000, or 21% year-over-year. Included in the total number as of September 30, 2020 are certain subscribers which are the subject of a contractual dispute. LiveXLive is currently not recognizing revenue related to these subscribers.
  • PodcastOne’s franchise of exclusive shows has grown to more than 235 as more than 350 podcast episodes are produced weekly. Total social media reach across the exclusive talent roster of PodcastOne now exceeds 261 million.
  • PodcastOne’s hit podcast, The LadyGang, reached a major milestone of 100 million downloads.
  • PodcastOne launched new exclusive podcasts with Adam Corolla, Pitbull, Amanda Cerny, Jacqueline Fernandez, Michael Irvin, Jeff Cesario, and Chris Myers.
  • Expanded sponsorship deals to now include Pepsi, McDonald’s, Hyundai, Corona, Porsche, Chipotle, State Farm, Kia, White Claw, Mike’s Hard Lemonade, and Mentos Pure Fresh Gum — and through LiveXLive’s multi-year livestream partnership with iHeartRadio – Progressive Insurance, Capital One, Ally Financial, Goya, Country Crock, St. Jude and OGX.
  • Exclusively produced and delivered livestream PPV concerts by Grammy-winner Pitbull, the Modern Drummer Festival, Darius Rucker, and K-Pop sensations Monsta X and Wonho. In addition, sold and distributed the “Live From Out There” PPVs.
  • Engagements within LiveXLive’s social media channels garnered a double-digit increase with total engagements up over 63% and average engagements per post up 122%.
  • Completed $17.5 million common stock financing at $4.14 per share.
  • Further improved the balance sheet by extending payment terms on $5.9 million of current payables owed to a music partner by twelve months and completed a $15.0 Million senior secured convertible notes financing agreement, convertible at $4.50 per share, with a major existing institutional stockholder in September 2020 and repaid senior secured debentures in August 2020.


Business Outlook

LiveXLive is raising its full-year fiscal 2021 guidance as follows:

  • Revenue of $63.5$69.5 million
  • Annualized Contribution Margin* of 30% – 35% of revenue
  • Adjusted Operating Loss* of ($2.5)($5.0) million
  • Capital expenditures, which principally include internally capitalized labor costs supporting the growth of our music platform, in the range of $3.0$5.0 million
  • Expectation to livestream over 100 music festivals and events

** With respect to projected full year 2021 Adjusted Operating Loss*, a quantitative reconciliation is not available without unreasonable efforts due to the high variability, complexity and low visibility with respect to purchase accounting adjustments, acquisition-related charges and legal settlement reserves excluded from Adjusted Operating Loss*.  We expect that the variability of these items could have a potentially unpredictable, and potentially significant, impact on our future GAAP financial results.


Second Quarter 2021 and 2020 Results Summary

(in $000

s, except per share; unaudited)


Three
Months
Ended
September 30,
2020


Three
Months
Ended
September 30,
2019

Revenue

$14,559

$9,583

Operating loss

$(7,126)

$(9,932)

Adjusted Operating Loss*

$(1,390)

$(3,705)

Net Loss

$(10,189)

$(10,619)

Loss per share – basic and diluted

$(0.15)

$(0.19)


Second Quarter 2021 Results Summary Discussion

During Q2 fiscal 2021, LiveXLive posted record revenue of $14.6 million versus $9.6 million in Q2 fiscal 2020. The increase was largely due to the growth in advertising, sponsorship, and PPV ticketing revenue offset by a decrease in subscription revenue as a result of certain subscribers subject to a contractual dispute. Paid subscribers as of September 30, 2020 increased 21% to 936,000, a net increase of 161,000 as compared to 775,000 subscribers at September 30, 2019. Included in the total number as of September 30, 2020 are certain subscribers which are the subject of a contractual dispute. LiveXLive is currently not recognizing revenue related to these subscribers.

LiveXLive livestreamed 29 live events during Q2 2021, as compared to 10 in Q2 2020, significantly reduced the cost per event, and made incremental investments to drive long-term growth. These growth activities drove a net loss of ($10.2) million, loss from operations of ($7.1) million and AOL* of ($1.4) million in Q2 fiscal 2021.

Q2 fiscal 2021 Operating Loss of ($7.1) million was lower as compared to a ($9.9) million Operating Loss in Q2 fiscal 2020. The $2.8 million improvement was largely driven by (i) a $3.1 million improvement in contribution margin* in Q2 fiscal 2021, as compared to Q2 fiscal 2020, driven by higher sponsorship revenue and a decrease in production expenses, and the addition of PodcastOne during the quarter, and (ii) offset by increased operating expenses of $0.3 million, primarily as a result of the addition of Podcast One.

Q2 fiscal 2021 AOL* of ($1.4) million improved by 62% or $2.3 million when compared to Q2 fiscal 2020 AOL* of ($3.7) million, driven by improved contribution margin* and operating expenses during the period. Q2 fiscal 2021 AOL* was driven by Operations loss of ($0.1) million and Corporate loss of ($1.3) million

Capital expenditures for Q2 fiscal 2021 totaled approximately $0.8 million, which were largely driven by capitalized software costs associated with development of our integrated music player and PPV services in Q2 fiscal 2021.

At September 30, 2020, LiveXLive had approximately $21.0 million in cash and cash equivalents, which includes restricted cash of $0.2 million

*
Refer to

About Non-GAAP Financial Measures

 
within this release for definitions of Adjusted Operating Income, Adjusted Operating Loss and Contribution Margin (Loss).


Conference Call and Webcast

LiveXLive will host a live conference call and audio webcast to provide a business update and discuss its second quarter fiscal 2021 results on Monday, November 16, 2020, beginning at 4:30 PM ET / 1:30 PM PT.

Conference Call & Webcast Information:

WHEN: Monday, November 16 at 4:30 PM ET / 1:30 PM PT
DOMESTIC DIAL-IN: 844-746-0736 
INTERNATIONAL DIAL-IN: 412-317-0796
The live call via webcast can be accessed on the Investor Relations section of LiveXLive’s website at http://ir.livexlive.com/upcoming-events.

The webcast will also be available on the Investor Relations section of LiveXLive’s website for a period of time following the completion of the call.


About LiveXLive Media, Inc.

Headquartered in Los Angeles, California, LiveXLive Media, Inc. (NASDAQ: LIVX) (the “Company”) (pronounced Live “by” Live) is a global platform for livestream and on-demand audio, video and podcast content in music, comedy, and pop culture. LiveXLive, which has streamed over 1500 artists since January 2020, has become a go-to partner for the world’s top artists and celebrity voices as well as music festivals and concerts, including Rock in Rio, EDC Las Vegas, and many others. In April 2020, LiveXLive produced its first 48-hour music festival called “Music Lives” with tremendous success as it earned over 50 million views and over 5 billion views for #musiclives on TikTok with over 100 performances. The Company’s library of global events, video-audio podcasts and original shows are also available on Amazon, Apple TV, Roku and Samsung TVs in addition to its own app, destination site and social channels. The Company’s wholly-owned subsidiary, PodcastOne, generates more than 2.1 billion downloads annually across more than 350 podcast episodes produces weekly. For more information, visit www.livexlive.com and follow us on FacebookInstagramTikTokTwitter at @livexlive, and YouTube.


* About Non-GAAP Financial Measures

To supplement our consolidated financial statements, which are prepared and presented in accordance with the accounting principles generally accepted in the United States of America (“GAAP”), we present Contribution Margin (Loss), Adjusted Operating Income (“AOI”) and Adjusted Operating Loss (“AOL”), which are non-GAAP financial measures, as measures of our performance. The presentation of these non-GAAP financial measures is not intended to be considered in isolation from, or as a substitute for, or superior to, operating loss and or net income (loss) or any other performance measures derived in accordance with GAAP or as an alternative to net cash provided by operating activities or any other measures of our cash flows or liquidity.

We use Contribution Margin (Loss) and AOL to evaluate the performance of our operating segment. We believe that information about these non-GAAP financial measures assists investors by allowing them to evaluate changes in the operating results of our business separate from non-operational factors that affect operating income (loss) and net income (loss), thus providing insights into both operations and the other factors that affect reported results. AOL is not calculated or presented in accordance with GAAP. A limitation of the use of AOL as a performance measure is that it does not reflect the periodic costs of certain amortizing assets used in generating revenue in our business. Accordingly, AOL should be considered in addition to, and not as a substitute for, operating income (loss), net income (loss), and other measures of financial performance reported in accordance with GAAP. Furthermore, this measure may vary among other companies; thus, AOL as presented herein may not be comparable to similarly titled measures of other companies.

Contribution Margin (Loss) is defined as revenue less Cost of Sales.  AOI/AOL is defined as operating income (loss) before (a) non-cash GAAP purchase accounting adjustments for certain deferred revenue and costs, (b) legal, accounting and other professional fees directly attributable to acquisition activity, (c) employee severance payments and third party professional fees directly attributable to acquisition or corporate realignment activities, (d) certain non-recurring expenses associated with legal settlements or reserves for legal settlements in the period that pertain to historical matters that existed at acquired companies prior to their purchase date and a one-time minimum guarantee to effectively terminate a live events distribution agreement post COVID-19, (e) depreciation and amortization (including goodwill impairment, if any), and (f) certain stock-based compensation expense.  Management does not consider these costs to be indicative of our core operating results.

With respect to projected full year 2021 AOL, a quantitative reconciliation is not available without unreasonable efforts due to the high variability, complexity and low visibility with respect to purchase accounting adjustments, acquisition-related charges and legal settlement reserves excluded from AOL.  We expect that the variability of these items to have a potentially unpredictable, and potentially significant, impact on our future GAAP financial results.

For more information on this non-GAAP financial measure, please see the table entitled “Reconciliation of Non-GAAP Measure to GAAP Measure” included at the end of this release.


Forward-Looking Statements

We make forward-looking statements in this release within the meaning of the Private Securities Litigation Reform Act of 1995 (the “PSLRA”). Certain statements contained in this earnings release (or otherwise made by us or on our behalf from time to time in other reports, filings with the U.S. Securities and Exchange Commission (the “SEC”), news releases, conferences, internet postings or otherwise) that are not statements of historical fact constitute “forward-looking statements” notwithstanding that such statements are not specifically identified. These forward-looking statements relate to our expectations or forecasts for future events, including without limitation our earnings, revenues, expenses, Adjusted Operating Income, Adjusted Operating Loss, Contribution Margin (Loss), capital expenditures or other future financial or business performance or strategies, or the impact of legal or regulatory matters on our business, results of operations or financial condition. These statements may be preceded by, followed by or include the words “may,” “might,” “will,” “will likely result,” “should,” “estimate,” “plan,” “project,” “forecast,” “intend,” “expect,” “anticipate,” “believe,” “hope,” “seek,” “continue,” “target” or similar expressions. These forward-looking statements are not guarantees of future performance and are based on information available to us as of the date of this release and on our current expectations, forecasts and assumptions, and involve substantial risks and uncertainties. Actual results may vary materially from those expressed or implied by the forward-looking statements herein due to a variety of factors, risks and uncertainties, including: the Company’s reliance on one key customer for a substantial percentage of its revenue; the Company’s ability to consummate any proposed financing or acquisitions and the timing of the closing of such proposed transactions, including the risks that a condition to closing would not be satisfied within the expected timeframe or at all or that the closing of any proposed transaction will not occur; the Company’s ability to continue as a going concern; the Company’s ability to attract, maintain and increase the number of its users and paid subscribers; the Company identifying, acquiring, securing and developing content; successfully implementing the Company’s growth strategy, including relating to its technology platforms and applications; ability to integrate the Company’s acquired businesses and the ability of the combined businesses to grow; the ability of the Company’s executive officers to manage expected growth profitably; the outcome(s) of any legal proceedings pending or that may be instituted against the Company, its subsidiaries or third parties to whom the Company may owe indemnification obligations; changes in laws or regulations that apply to the Company or its industry; the Company’s ability to recognize and timely implement future technologies in the music and livestreaming space; the Company’s ability to capitalize on investments in developing its service offerings, including LiveXLive app to deliver and develop upon current and future technologies; significant product development expenses associated with the Company’s technology initiatives; the Company’s ability to deliver end-to-end network performance sufficient to meet increasing customer demands; the Company’s ability to timely and economically obtain necessary approval(s), releases and or licenses on a timely basis for the use of its music content on its service platform; the Company’s ability to obtain and maintain international authorizations to operate its service over the proper foreign jurisdictions its customers utilize; the Company’s ability to expand its service offerings and deliver on its service roadmap; the Company’s ability to timely and cost-effectively produce, identify and or deliver compelling content that brands will advertise on and or customers will purchase and or subscribe to across the Company’s platform; the effects of the global Covid-19 pandemic; general economic and technological circumstances in the music and livestreaming digital markets; the Company’s ability to obtain and maintain licenses for content used on legacy music platforms; the loss of, or failure to realize benefits from, agreements with our music labels, publishers and partners; unfavorable economic conditions in the airline industry and economy as a whole; the Company’s ability to expand its domestic or international operations, including the Company’s ability to grow its business with current and potential future music labels, festivals, publishers, or partners; the effects of service interruptions or delays, technology failures, material defects or errors in our software, damage to the Company’s equipment or geopolitical restrictions; costs associated with defending pending or future intellectual property infringement actions and other litigation or claims; increases in the Company’s projected capital expenditures due to, among other things, unexpected costs incurred in connection with the roll out of the Company’s business plans and technology roadmap or the Company’s plans of expansion in North America and internationally; fluctuation in the Company’s operating results; the demand for live and music streaming services and market acceptance for our products and services; the Company’s ability to generate sufficient cash flow to make payments on its indebtedness; the Company’s incurrence of additional indebtedness in the future; the Company’s ability to repay the convertible notes at maturity or to repurchase the convertible notes upon a fundamental change or at specific repurchase dates; the effect of the conditional conversion feature of the convertible notes; the Company’s compliance with the covenants in its senior notes; risks and uncertainties applicable to the businesses of the Company’s subsidiaries and other risks, uncertainties and factors, including, but not limited to, those described in the Company’s 2020 Annual Report on Form 10-K for the fiscal year ended March 31, 2020, filed with the SEC on June 26, 2020, Quarterly Report on Form 10-Q for the quarter ended September 30, 2020, filed with the SEC on November 16, 2020, and in the Company’s other filings with the SEC.  The forward-looking statements contained in this press release speak only as of the date the statements were made. The Company does not undertake any obligation to update these forward-looking statements, unless required by law. The Company intends that all forward-looking statements be subject to the safe-harbor provisions of the PSLRA.

LiveXLive IR Contact: 
310.529.2500
[email protected]

LiveXLive Press Contact
The Rose Group
[email protected] 
[email protected]

Financial Information

The tables below present financial results for the three and six months ended September 30, 2020 and 2019.


LiveXLive Media, Inc.


 Consolidated Statements of Operations (Unaudited)


(In thousands, except share and per share amounts)


Three Months Ended
September 30,


Six Months Ended
September 30,


2020


2019


2020


2019


Revenue:

$

14,559

$

9,583

$

25,066

$

19,081


Operating expenses:

Cost of sales

10,299

8,453

17,960

17,466

Sales and marketing

2,076

2,100

3,422

3,811

Product development

2,288

2,505

4,374

4,928

General and administrative

5,615

5,103

9,600

9,928

Amortization of intangible assets

1,407

1,354

2,658

3,142

Total operating expenses

21,685

19,515

38,014

39,275


Loss from operations

(7,126)

(9,932)

(12,948)

(20,194)


Other income (expense):

Interest expense, net

(1,021)

(940)

(3,099)

(1,810)

Loss on extinguishment of debt

(1,488)

(1,488)

Other income (expense)

(552)

253

(182)

419

Total other income (expense), net

(3,061)

(867)

(4,769)

(1,391)


Loss before provision for income taxes

(10,187)

(10,619)

(17,717)

(21,585)

Provision for income taxes

(2)

(4)


Net loss

$

(10,189)

$

(10,619)

$

(17,721)

$

(21,585)


Net loss per share – basic and diluted

$

(0.15)

$

(0.19)

$

(0.28)

$

(0.40)


Weighted average common shares – basic and diluted

69,035,037

55,891,299

64,127,618

54,115,343


LiveXLive Media, Inc.


Consolidated Balance Sheets


(In thousands)


(Unaudited)


September 30,


March 31,


2020


2020


Assets


Current Assets

Cash and cash equivalents

$

20,744

$

5,702

Restricted cash

235

6,735

Accounts receivable, net

8,561

3,889

Prepaid expense and other assets

3,941

1,396


Total Current Assets

33,481

17,722

Property and equipment, net

3,617

3,397

Goodwill

21,517

9,672

Intangible assets, net

22,322

23,198

Other assets

76

127


Total Assets

$

81,013

$

54,116


Liabilities and Stockholders’ Equity (Deficit)


Current Liabilities

Accounts payable and accrued liabilities

$

20,737

$

30,723

Accrued royalties

15,724

13,071

Notes payable, net

1,862

331

Deferred revenue

1,677

949

Unsecured convertible notes, net

5,300

Senior secured convertible debentures, net

2,720


Total Current Liabilities

45,300

47,794

Senior secured convertible debentures, net

6,505

Unsecured convertible notes, net

1,818

6,794

Senior secured convertible notes, net

12,874

Notes payable, net

1,106

Other long-term liabilities

6,609

45

Deferred income taxes

108

108


Total Liabilities

67,815

61,246


Commitments and Contingencies


Stockholders’ Equity (Deficit)

Preferred stock, $0.001 par value; 10,000,000 shares authorized; no shares issued or 
     outstanding

Common stock, $0.001 par value; 500,000,000 shares authorized; 71,689,101 and 
     58,984,382 shares issued and outstanding, respectively

72

59

Additional paid in capital

158,968

120,932

Accumulated deficit

(145,842)

(128,121)

Total stockholders’ equity (deficit)

13,198

(7,130)


Total Liabilities and Stockholders’ Equity (Deficit)

$

81,013

$

54,116


Reconciliation of Non-GAAP Measure to GAAP Measure


(In thousands)


(Unaudited)


LiveXLive Media, Inc.


Adjusted Operating Income (Loss)* Reconciliation


Contribution Margin


Operating Loss from Operations


Depreciation  and Amortization


Stock-Based Compensation


Non-Recurring Acquisition and Realignment Costs


Other Non-Operating
Costs


Adjusted Operating Loss*


Three Months
Ended
September 30,
2020

Operations

$

4,260

$

(3,968)

$

2,221

$

1,167

$

$

453

$

(127)

Corporate

(3,158)

1,292

81

522

(1,263)

Total

$

4,260

$

(7,126)

$

2,221

$

2,459

$

81

$

975

$

(1,390)


Three Months
Ended
September 30,
2019

Operations

$

1,130

$

(6,069)

$

1,984

$

1,969

$

$

45

$

(2,071)

Corporate

(3,863)

790

1,439

(1,634)

Total

$

1,130

$

(9,932)

$

1,984

$

2,759

$

$

1,484

$

(3,705)


Contribution Margin


Operating Loss from Operations


Depreciation and Amortization


Stock-Based Compensation


Non-Recurring Acquisition and Realignment Costs


Other Non-Operating Costs


Adjusted Operating Income(Loss)*


Six months
Ended
September 30,
2020

Operations

$

7,106

$

(6,433)

$

4,195

$

2,518

$

$

707

$

987

Corporate

(6,515)

2,823

371

889

(2,432)

Total

$

7,106

$

(12,948)

$

4,195

$

5,341

$

371

$

1,596

$

(1,445)


Six months
Ended
September 30,
2019

Operations

$

1,615

$

(13,088)

$

4,213

$

3,140

$

$

45

$

(5,690)

Corporate

(7,106)

2

2,736

1,764

(2,604)

Total

$

1,615

$

(20,194)

$

4,215

$

5,876

$

$

1,809

$

(8,294)

(1)

Non-Recurring Acquisition and Realignment Costs principally include outside legal, accounting and other professional fees directly attributable to acquisition activity in the period.

(2)

Other Non-Recurring Costs principally include certain non-recurring expenses associated with legal settlements or reserves for legal settlements in the period that pertain to historical matters that existed at certain acquired companies prior to their purchase date and non-recurring employee severance payments and to a lesser extent, a one-time minimum guarantee to effectively terminate a live -event distribution agreement post COVID-19.

* See the definition of Adjusted Operating Income and Adjusted Operating Loss under “About Non-GAAP Financial Measures” within this release.


Reconciliation of Non-GAAP Measure to GAAP Measure


(In thousands)


(Unaudited)


LiveXLive Media, Inc.


Contribution Margin* Reconciliation


Three Months Ended
September 30,


Nine Months Ended
September 31,


2020


2019


2020


2019


Revenue:

$

14,559

$

9,583

$

25,066

$

19,081


Less Cost of Sales:


(10,299)


(8,453)


(17,960)


(17,466)


Contribution Margin*


$


4,260


$


1,130


$


7,106


$


1,615

* See the definition of Contribution Margin under “About Non-GAAP Financial Measures” within this release.


Cision View original content to download multimedia:http://www.prnewswire.com/news-releases/livexlive-media-announces-q2-fiscal-2021-results-and-10th-consecutive-quarter-of-record-revenue-301174002.html

SOURCE LiveXLive Media, Inc.

Neptune Reports Second Quarter Fiscal 2021 Results

PR Newswire

2021/Q2 revenue +340% YOY and +155% over 2021/Q1,
driven by the addition of Health and Wellness Innovations consumer products and growth of Cannabis related product revenue

Appoints Dr. Toni Rinow as Global Operating Officer

LAVAL, QC, Nov. 16, 2020 /CNW Telbec/ – Neptune Wellness Solutions Inc. (“Neptune” or the “Company”) (NASDAQ: NEPT) (TSX: NEPT), a diversified and fully integrated health and wellness company focused on plant-based, sustainable and purpose-driven lifestyle brands, today announced its financial and operating results for the three-month and six-month periods that ended September 30, 2020.

All amounts are in thousands of Canadian dollars except if specified otherwise.

Second Quarter 2021 Financial Highlights

  • Total revenues for the three-month period ended September 30, 2020 amounted to $28,686 representing a sequential increase of $17,439 or 155%, over the restated revenues of the first quarter ended June 30, 2020 of $11,247, and an increase of $22,174 or 340%, compared to $6,512 for the three-month period ended September 30, 2019.
  • Gross profits for the three-month period ended September 30, 2020 decreased to a loss of $4,552 compared to profit of $3,256 in the first quarter ended June 30, 2020 and profit of $9 for the three-month period ended September 30, 2019. Gross margin declined to a loss of 15.9% as a result of strategic investments to position the Company for further distribution growth.
  • Investments of approximately $1.9 million in capex related to the Sherbrooke facility, to adapt it from low margin B2B offering to high margins B2C offerings, such as our Mood Ring™ offerings.
  • Adjusted EBITDA1 declined by $8,339 for the second quarter of fiscal year 2021 to a loss of $12,920 compared to the second quarter of fiscal year 2020. The decline in Adjusted EBITDA1 is mainly attributable to the change in net loss, the decrease in acquisition costs, in stock-based compensation , in excluded net finance costs and in income tax recovery, partly offset by the increase in non-employees compensation related to warrants ($2.5 million), in depreciation and amortization and by the costs related to a one-time cybersecurity incident, which was resolved by Neptune with no expected material effect on our operations going forward.

________________________________________________________________


1 See “Caution Regarding Non-IFRS Financial Measures” and “Adjusted EBITDA” which follow.

  • Net loss for the three-month period ended September 30, 2020 increased at $21,840 compared to a net loss of $20,775 for the three-month period ended September 30, 2019, up by $1,065 or 5%. Included in the net loss for the quarter ended
    September 30, 2020, there was $5.5 million in non-cash transactions that were adjusted out of EBITDA, and a little less than $2.0 million for the cybersecurity incident previously mentioned.
  • The Company restated its previously filed condensed consolidated interim financial statements as at and for the three-month period ended June 30, 2020 with respect to recognition of revenue relating to one transaction that was initially recognized at the gross amount and was restated to present the net amount of the transaction. There is no impact on the net loss in the condensed consolidated interim statement of loss and comprehensive loss resulting form this restatement. The restatement of the June 30, 2020 interim statements includes management’s conclusion that Company’s internal control over financial reporting (“ICFR”) was not effective as at June 30, 2020, due to the existence of a material weakness in its design and the Company’s plans to remediate such weakness.

Recent Corporate Highlights


  • September 17, 2020:
     Neptune announced “Wonders of Africa” essential oil kit is made with sustainable ingredients and eco-friendly packaging. This marks the first of its product lines made in collaboration with legendary animal behavior expert and conservationist, Dr. Jane Goodall, under its Forest Remedies™ brand.

  • September 22, 2020:
     Neptune announced an import and stocking distribution partnership with one of the world’s leading consumer goods companies, making and selling around 400 brands in more than 190 countries, for professional beauty, personal care and hygiene product lines generating potential sales revenue from as much as USD $65 million up to USD $137 million over the next 18 months based on the consumer product company’s and Neptune’s projections.

  • September 24, 2020:
     Neptune announced it had entered into an agreement with the British Columbia Liquor Distribution Branch (“BCLDB”), the wholesaler and public retailer of nonmedical cannabis throughout the province, for the sale and distribution of Neptune’s new proprietary M Mood Ring™ product line.

  • October 23, 2020:
     Neptune announced it had closed a private placement with certain US healthcare focused institutional investors for gross proceeds of approximately US$35 million.

  • October 27, 2020:
     Neptune announced a supply agreement with the Ontario Cannabis Store (OCS), the wholesaler and sole online retailer for recreational cannabis, for the sale and distribution of Neptune’s new proprietary recreational product line, Mood Ring™.  Together with the BCLDB announcement, this represents at least 515 retailers.

  • October 30, 2020:
     Neptune announced that its Innovations business unit has entered into a letter of credit facility with Perceptive Advisors to provide the Company with up to US$45 million to support the fulfillment of large purchase orders placed by a customer.

  • November 16, 2020:
     Neptune today announced it received over US$100 million in purchase orders for its Biodroga and Innovations divisions.  The purchase orders come from six different Neptune clients and the booked sales of about $100 million are scheduled to ship in the next 2 quarters.

  • November 16, 2020:
     Neptune today announced the appointment of Dr. Toni Rinow as Global Operating Officer in addition to her current role as Chief Financial Officer, effective immediately.  Dr. Rinow has been instrumental in increasing efficiencies and future profitability across Neptune’s business units, reducing its headcount by 25% to focus on forward-thinking initiatives and to accelerate growth with less focus on long-term, asset heavy investments.  David Myers, who was previously Chief Operating Officer, recently left the Company for personal reasons.

Management Commentary

Michael Cammarata, Chief Executive Officer of Neptune, stated: “I am pleased with our strong top line growth and the successful strategic investments we made during the second quarter of fiscal 2021.   We are transforming Neptune into a leading consumer-packaged goods (“CPG”) company by making the appropriate investments into our distribution reach in both business-to-business (“B2B”) and business-to-consumer (“B2C”) channels.

We continue to focus on innovation, expanding our broad portfolio of natural, plant-based, and sustainable brands in key health and wellness markets, including hemp, nutraceuticals, personal care, and home care. We are on track for our CPG products to exceed 70% of our revenues in the third quarter of fiscal 2021 and expect this segment of our business to continue to generate very strong growth. The investments and operating efficiencies we implemented in the first and second quarters of fiscal 2021 and will continue to make in the third quarter of 2021, have us well positioned to begin realizing the tremendous revenue from our purchase orders to come.  These orders combined with the growth of our other areas will drive profitable accretive growth with limited incremental capital investment, ultimately driving higher margins and higher returns.”

Dr. Toni Rinow, Chief Financial Officer and Global Operating Officer of Neptune, added: “During the second quarter we saw continued growth to our top line while we made additional strategic investments in the future of the Company and in our distribution channels. These investments were an important steppingstone into the next phase of growth. Moving into the back half of fiscal 2021 we are sufficiently capitalized and well positioned to deliver on  growth in purchase orders in the fourth fiscal quarter of 2021 and as we move into the first half of fiscal 2022. We remain focused on innovation that will continue to help customers, from the time they wake up to when they go to sleep.”

Operational Update

During the quarter, Neptune executed on a dual go-to market B2B and B2C strategy focused on dramatically expanding its global distribution reach. Neptune is greatly accelerating its global distribution network and expects CPG distribution to exceed 70% of the Company’s revenues in the third quarter of fiscal 2021; this compares to zero for the same period in the previous year.

Additionally, Neptune continues to build a broad portfolio of natural, plant-based, and sustainable brands and CPG products in key health and wellness markets, including hemp, nutraceuticals, personal care, and home care.

Conference Call Details

Date:

Monday, November 16, 2020

Time:

4:30 PM Eastern Daylight Time

Call:

1 (888) 231-8191 (Canada and U.S.)

1 (647) 427-7450 (International)

Conference ID: 9196032

There will also be a simultaneous, live webcast available on the Investors section of Neptune’s website under Investor Events and Presentations at www.neptunecorp.com or directly at https://produceredition.webcasts.com/starthere.jsp?ei=1388592&tp_key=4b8fec85a6. The webcast will be archived for approximately 30 days.


About Neptune Wellness Solutions Inc.

Neptune Wellness Solutions is a unique global health and wellness company that is changing consumer habits through the creation and distribution of environmentally friendly, ethical and innovative consumer product goods. Neptune’s simultaneous focus on B2C and B2B customer-oriented brand development provides the Company with international reach and scale from its owned and operated facilities that extract and create product formulation, all the way to the sales floor at top global retailers.

Underpinned by a disruptive spirit, Neptune’s diversified, and fully integrated business model focuses on natural, plant-based, sustainable and purpose-driven lifestyle brands and the use of cannabinoids in household products to make them safer, healthier and more effective. Its portfolio includes emerging brands such as Forest Remedies™, Ocean Remedies™, Neptune Wellness™, Mood Ring™, and OCEANO3™, which are poised for rapid growth and expansion.

Backed with a cost-efficient manufacturing and supply chain infrastructure that can be scaled up and down or into adjacent product categories to identify new innovation opportunities, Neptune quickly adapts to consumer preferences and demand, and is bringing its products as well as other Fortune 100 brands to market through strategic distribution partnerships, mass retail partners and e-commerce channels. Neptune is committed to its core mission of redefining health and wellness and helping humanity thrive by providing sustainable consumer focused solutions. For additional information, please visit: www.neptunecorp.com


Caution Regarding Non-IFRS Financial Measures

The Corporation uses one adjusted financial measure, Adjusted Earnings Before Interest, Taxes, Depreciation and Amortization (Adjusted EBITDA) to assess its operating performance. This non-IFRS financial measure is comprised of adjustments that are derived from the Corporation’s financial statements and are presented in a consistent manner. The Corporation uses this measure for the purposes of evaluating its historical and prospective financial performance, as well as its performance relative to competitors. This measure also helps the Corporation to plan and forecast for future periods as well as to make operational and strategic decisions. The Corporation believes that providing this information to investors, in addition to IFRS measures, allows them to see the Corporation’s results through the eyes of management, and to better understand its historical and future financial performance.

Securities regulations require that companies caution readers that earnings and other measures adjusted to a basis other than IFRS do not have standardized meanings and are unlikely to be comparable to similar measures used by other companies. Accordingly, they should not be considered in isolation. The Corporation uses Adjusted EBITDA to measure its performance from one period to the next without the variation caused by certain adjustments that could potentially distort the analysis of trends in our operating performance, and because the Corporation believes it provides meaningful information on the Corporation’s financial condition and operating results. Neptune’s method for calculating Adjusted EBITDA may differ from that used by other corporations.

Neptune obtains its Adjusted EBITDA measurement by adding to net income (loss), net finance costs and depreciation and amortization and by subtracting income tax recovery. Other items such as stock-based compensation, non-employees compensation related to warrants, litigation provisions, acquisition costs, signing bonuses, severances and related costs of the Corporation are also added back as they may vary significantly from one period to another. Adjusting for these items does not imply they are non-recurring. 


Forward Looking Statements

Statements in this press release that are not statements of historical or current fact constitute “forward-looking statements” within the meaning of the U.S. securities laws and Canadian securities laws. Such forward-looking statements involve known and unknown risks, uncertainties, and other unknown factors that could cause the actual results of Neptune to be materially different from historical results or from any future results expressed or implied by such forward-looking statements. In addition to statements which explicitly describe such risks and uncertainties, readers are urged to consider statements labeled with the terms “believes”, “belief”, “expects”, “intends”, “projects”, “anticipates”, “will”, “should” or “plans” to be uncertain and forward-looking. Readers are cautioned not to place undue reliance on these forward-looking statements, which speak only as of the date of this press release.

The forward looking statements contained in this press release are expressly qualified in their entirety by this cautionary statement and the “Cautionary Note Regarding Forward-Looking Information” section contained in Neptune’s latest Annual Information Form (the “AIF”), which also forms part of Neptune’s latest annual report on Form 40-F, and which is available on SEDAR at www.sedar.com, on EDGAR at www.sec.gov/edgar.shtml and on the investor section of Neptune’s website at www.neptunecorp.com. All forward-looking statements in this press release are made as of the date of this press release. Neptune does not undertake to update any such forward-looking statements whether as a result of new information, future events or otherwise, except as required by law. The forward-looking statements contained herein include, without limitation, statements about the fulfillment of purchase orders, the availability of products from Neptune’s supplier, and the anticipated use of proceeds of the financing and other risks and uncertainties that are described from time to time in Neptune public securities filings with the Securities and Exchange Commission and the Canadian securities commissions. Additional information about these assumptions and risks and uncertainties is contained in the AIF under “Risk Factors”.

Neither NASDAQ nor the Toronto Stock Exchange accepts responsibility for the adequacy or accuracy of this release.

NEPTUNE WELLNESS SOLUTIONS INC.
Condensed Consolidated Interim Statements of Loss and Comprehensive Loss
(Unaudited)
For the three-month and six-month periods ended September 30, 2020 and 2019

Three-month periods ended

Six-month periods ended

September
30,

2020

September
30,

2019

September
30,

2020 (1)

September
30,

2019

Revenue from sales and services

$

28,308,364

$

6,021,177

$

39,214,637

$

10,010,675

Royalty revenues

378,119

348,306

694,647

690,169

Other revenues

142,798

24,236

172,445

Total revenues (note 12)

28,686,483

6,512,281

39,933,520

10,873,289

Cost of sales

(33,238,654)

(6,503,606)

(41,229,266)

(11,576,789)

Gross profit (loss)

(4,552,171)

8,675

(1,295,746)

(703,500)

Research and development expenses, net of tax credits

and grants of ($2,273) and $16,227 (2019 – ($53,999) and ($33,947))

(566,117)

(540,950)

(1,001,069)

(883,286)

Selling, general and administrative expenses (note 11 (b)(iv))

(18,433,852)

(16,781,456)

(31,288,734)

(22,111,321)

Loss from operating activities

(23,552,140)

(17,313,731)

(33,585,549)

(23,698,107)

Finance income

13,416

63,966

31,059

82,803

Finance costs

(154,716)

(4,320,136)

(290,359)

(4,434,196)

Foreign exchange gain (loss)

(944,601)

767,685

(2,283,793)

744,188

(1,085,901)

(3,488,485)

(2,543,093)

(3,607,205)

Loss before income taxes

(24,638,041)

(20,802,216)

(36,128,642)

(27,305,312)

Income tax recovery

2,797,920

27,409

2,861,110

78,356

Net loss

(21,840,121)

(20,774,807)

(33,267,532)

(27,226,956)

Other comprehensive income (loss)

Unrealized gains (losses) on investment (note 10)

(370,001)

2,994,340

(260,000)

2,795,458

Net change in unrealized foreign currency losses on

translation of net investments in foreign operations

(1,055,154)

(705,451)

(2,606,633)

(705,451)

Total other comprehensive income (loss)

(1,425,155)

2,288,889

(2,866,633)

2,090,007

Total comprehensive loss

$

(23,265,276)

$

(18,485,918)

$

(36,134,165)

$

(25,136,949)

Basic and diluted loss per share

$

(0.20)

$

(0.23)

$

(0.31)

$

(0.32)

Basic and diluted weighted average number of common shares

111,044,790

90,278,908

106,796,307

85,542,521


(1)

Refer to note 14 – Restatement of prior period figures.

See accompanying notes to unaudited condensed consolidated interim financial statements.

NEPTUNE WELLNESS SOLUTIONS INC.
Condensed Consolidated Interim Statements of Financial Position
(Unaudited)
As at September 30, 2020 and March 31, 2020

September 30,

March 31,

2020

2020

Assets

Current assets:

Cash and cash equivalents

$

9,089,029

$

16,577,076

Short-term investment

24,032

36,000

Trade and other receivables

22,400,059

10,793,571

Prepaid expenses

3,561,634

2,296,003

Inventories (note 5)

21,609,305

9,092,538

56,684,059

38,795,188

Property, plant and equipment

63,659,677

60,028,574

Right-of-use assets

1,151,263

1,386,254

Intangible assets

21,034,519

25,518,287

Goodwill (note 4)

40,269,896

42,333,174

Tax credits recoverable

184,470

184,470

Deferred tax assets

172,339

Other asset (note 10)

270,000

530,000

Total assets

$

183,426,223

$

168,775,947

Liabilities and Equity

Current liabilities:

Trade and other payables

$

16,175,786

$

12,451,669

Lease liabilities

460,408

450,125

Loans and borrowings (note 6)

3,232,732

3,180,927

Deferred revenues

250,909

17,601

Provisions (note 7)

1,596,273

1,115,703

21,716,108

17,216,025

Lease liabilities

888,823

1,141,314

Long-term payables

278,202

555,440

Deferred tax liabilities

2,058,878

5,015,106

Other liability (note 13)

2,450,696

1,217,769

Total liabilities

27,392,707

25,145,654

Equity:

Share capital (note 8)

257,528,865

213,876,454

Warrants (note 8 (e))

22,014,403

18,597,776

Contributed surplus

70,641,663

69,173,313

Accumulated other comprehensive income

2,650,743

5,517,376

Deficit

(196,802,158)

(163,534,626)

Total equity

156,033,516

143,630,293

Commitments and contingencies (note 11)

Subsequent events (note 15)

Total liabilities and equity

$

183,426,223

$

168,775,947

See accompanying notes to unaudited condensed consolidated interim financial statements.

ADJUSTED EBIDTA

Although the concept of Adjusted EBIDTA is not a financial or accounting measure defined under IFRS and it may not be comparable to other issuers, it is widely used by companies.  Neptune obtains its Adjusted EBITDA measurement by adding to net income (loss), net finance costs and depreciation and amortization, and by subtracting income tax recovery. Other items such as stock-based compensation, non-employees compensation related to warrants, litigation provisions, acquisition costs, signing bonuses, severances and related costs of the Corporation are also added back as they may vary significantly from one period to another. Adjusting for these items does not imply they are non-recurring.

Adjusted EBITDA1 reconciliation, in thousands of dollars

Three-month periods ended

Six-month periods ended

September
30,

September
30,

September
30,

September
30,

2020

2019

2020

2019

Net loss for the period

$

(21,840)

$

(20,775)

$

(33,268)

$

(27,227)

Add (deduct):

Depreciation and amortization

2,792

2,133

5,550

3,216

Net finance costs

1,086

3,488

2,543

3,607

Stock-based compensation

2,654

7,879

6,152

8,736

Non-employees compensation related to warrants

2,542

3,417

Provisions

267

79

481

160

Acquisition costs

1,792

2,159

Signing bonuses, severances and related costs

394

850

601

1,263

Cybersecurity incident

1,983

1,983

Income tax recovery

(2,798)

(27)

(2,861)

(78)

      Adjusted EBITDA1

$

(12,920)

$

(4,581)

$

(15,402)

$

(8,164)

Please note that non-employees compensation related to warrants and signing bonuses are new additions to the Company’s calculation methodology for the quarter ended September 30, 2020.  Signing bonuses did not occur previously, so no restatement of the previous periods was needed, but there were non-employees compensation expenses related to warrants in previous quarters; consequently, the amount for the six-month period ended September 30, 2020 reflects the sum of those expenses for the first ($875) and second ($2,542) quarters of FY2021, and no corrections were needed for the three-month and six-month periods ended September 30, 2019.

_______________________________________________________


1 The Adjusted EBITDA is not a standard measure endorsed by IFRS requirements.


Cision View original content to download multimedia:http://www.prnewswire.com/news-releases/neptune-reports-second-quarter-fiscal-2021-results-301174010.html

SOURCE Neptune Wellness Solutions Inc.

Ideanomics Announces MEG October & Q4 Sales Activity

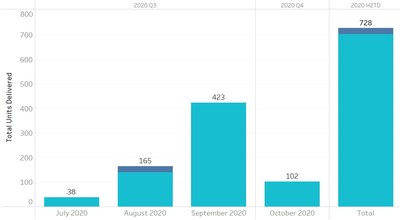
– A total of 102 units delivered in October

– Units delivered were from the taxi and ride hailing segment

– Orders continue to be received for the fourth quarter

PR Newswire

NEW YORK, Nov. 16, 2020 /PRNewswire/ — Ideanomics (NASDAQ: IDEX) (“Ideanomics” or the “Company”) announces its Mobile Energy Global (MEG) division’s sales activities for the month of October.

For the period starting October 1, 2020, through October 31, 2020, MEG delivered a total of 102 units, all of which were taxi/ride-hailing vehicles. The 340 units that were invoiced during July through September 2020 are still pending expected delivery. During the month of October, China had two major national holidays overlap, which resulted in fewer business days. As a result, it was expected to be a lower delivery volume month.

“As we enter the final months of 2020, our sales efforts are focused on progressing opportunities for larger vehicle orders towards completion, and expanding our deliveries into battery systems and charging piles as part of testing programs with our customers and partners,” said Mr. Alf Poor, CEO of Ideanomics. “As we look to round out Q4 and 2020, our goal is to deliver quarter over quarter growth while building our order book so that we can hit the ground running in 2021.”

About Ideanomics

Ideanomics is a global company focused on the convergence of financial services and industries experiencing technological disruption. Our Mobile Energy Global (MEG) division is a service provider which facilitates the adoption of electric vehicles by commercial fleet operators through offering vehicle procurement, finance and leasing, and energy management solutions under our innovative sales to financing to charging (S2F2C) business model. Ideanomics Capital is focused on disruptive fintech solutions for the financial services industry. Together, MEG and Ideanomics Capital provide our global customers and partners with leading technologies and services designed to improve transparency, efficiency, and accountability, and our shareholders with the opportunity to participate in high-potential, growth industries.

The company is headquartered in New York, NY, with offices in Beijing, Hangzhou, and Qingdao, and operations in the U.S., China, Ukraine, and Malaysia.

Safe Harbor Statement
This press release contains certain statements that may include “forward looking statements”. All statements other than statements of historical fact included herein are “forward-looking statements.” These forward-looking statements are often identified by the use of forward-looking terminology such as “believes,” “expects” or similar expressions, involve known and unknown risks and uncertainties, and include statements regarding our intention to transition our business model to become a next-generation financial technology company, our business strategy and planned product offerings, our intention to phase out our oil trading and consumer electronics businesses, and potential future financial results. Although the Company believes that the expectations reflected in such forward-looking statements are reasonable, they do involve assumptions, risks and uncertainties, and these expectations may prove to be incorrect. You should not place undue reliance on these forward-looking statements, which speak only as of the date of this press release. The Company’s actual results could differ materially from those anticipated in these forward-looking statements as a result of a variety of risks and uncertainties, such as risks related to: our ability to continue as a going concern; our ability to raise additional financing to meet our business requirements; the transformation of our business model; fluctuations in our operating results; strain to our personnel management, financial systems and other resources as we grow our business; our ability to attract and retain key employees and senior management; competitive pressure; our international operations; and other risks and uncertainties disclosed under the sections entitled “Risk Factors” and “Management’s Discussion and Analysis of Financial Condition and Results of Operations” in our most recent Form 10-K and Form 10-Q filed with the Securities and Exchange Commission, and similar disclosures in subsequent reports filed with the SEC, which are available on the SEC website at www.sec.gov. All forward-looking statements attributable to the Company or persons acting on its behalf are expressly qualified in their entirety by these risk factors. Other than as required under the securities laws, the Company does not assume a duty to update these forward-looking statements.

Investor Relations and Media Contact

Ideanomics, Inc.
Tony Sklar, SVP of Investor Relations
1441 Broadway, Suite 5116, New York, NY 10018
[email protected]

Valerie Christopherson / Lora Wilson
Global Results Communications (GRC)
+1 949 306 6476
[email protected] 

Cision View original content to download multimedia:http://www.prnewswire.com/news-releases/ideanomics-announces-meg-october–q4-sales-activity-301173990.html

SOURCE Ideanomics

Brooks to Participate in the Stephens Annual Investment Virtual Conference 2020

PR Newswire

CHELMSFORD, Mass., Nov. 16, 2020 /PRNewswire/ — Brooks Automation, Inc. (Nasdaq: BRKS) announced today that company management will participate in Stephens Annual Investment Conference 2020 on Thursday, November 19, 2020 which includes a 45-minute webcast beginning at 9:00 a.m. ET.  The live webcast can be accessed through the Brooks investor relations website at www.brooks.investorroom.com/events.  A replay of the webcast will be available following the event.

About Brooks Automation
Brooks (Nasdaq: BRKS) is a leading provider of life science sample-based solutions and semiconductor manufacturing solutions worldwide.  The Company’s Life Sciences business provides a full suite of reliable cold-chain sample management solutions and genomic services across areas such as drug development, clinical research and advanced cell therapies for the industry’s top pharmaceutical, biotech, academic and healthcare institutions globally.  Brooks Life Sciences’ GENEWIZ division is a leading provider of gene sequencing and gene synthesis services.  With over 40 years as a partner to the semiconductor manufacturing industry, Brooks is a provider of industry-leading precision vacuum robotics, integrated automation systems and contamination control solutions to the world’s leading semiconductor chip makers and equipment manufacturers.  Brooks is headquartered in Chelmsford, MA, with operations in North America, Europe and Asia.  For more information, visit www.brooks.com.

INVESTOR CONTACTS:

Mark Namaroff

Director, Investor Relations
Brooks Automation
978.262.2635
[email protected]

Sherry Dinsmore

Brooks Automation
978.262.2400
[email protected]

Cision View original content to download multimedia:http://www.prnewswire.com/news-releases/brooks-to-participate-in-the-stephens-annual-investment-virtual-conference-2020-301173914.html

SOURCE Brooks Automation

Graybug Vision to Participate in the 32nd Annual Piper Sandler Healthcare Conference

REDWOOD CITY, Calif., Nov. 16, 2020 (GLOBE NEWSWIRE) — Graybug Vision, Inc. (Nasdaq: GRAY), a clinical-stage biopharmaceutical company focused on developing transformative medicines for the treatment of diseases of the retina and optic nerve, today announced that Fred Guerard, PharmD, Chief Executive Officer of Graybug Vision, will participate in a fireside chat in advance of the virtual Piper Sandler Healthcare Conference, being held December 1-3, 2020.

A recording of the fireside chat will be accessible beginning November 23, 2020 by visiting IR Events & Presentations in the Investors and Media section of the company’s website at https://investors.graybug.vision/news-events/events-presentations. The recording will be available on the Graybug website for 14 days following the conference.

About Graybug
Vision

Graybug is a clinical-stage biopharmaceutical company focused on developing transformative medicines for the treatment of diseases of the retina and optic nerve. The company’s proprietary ocular delivery technologies are designed to maintain effective drug levels in ocular tissue for six months and potentially longer, improving disease management, reducing healthcare burdens and ultimately delivering better clinical outcomes. Graybug’s lead product candidate, GB-102, a microparticle depot formulation of the pan-vascular endothelial growth factor (VEGF) inhibitor, sunitinib malate, targeting a six-month or longer dosing regimen, inhibits multiple neovascular pathways for the intravitreal treatment of retinal diseases, including wet age-related macular degeneration. Graybug is also using its proprietary technologies to develop GB-401, an injectable depot formulation of a beta-adrenergic blocker prodrug, for primary open-angle glaucoma, with a dosing regimen of once every six months or longer, and GB-103, a longer-acting version of GB-102, designed to maintain therapeutic drug levels in the retinal tissue for 12 months with a single injection. Founded in 2011 on the basis of technology licensed from the Johns Hopkins University School of Medicine, Graybug is headquartered in Redwood City, California. For more information, please visit www.graybug.vision.

Investor Contact

[email protected]

(650) 487-2409

Media Contact

[email protected]

(404) 384-0067


VERB Reports Record-Breaking Digital Revenues in 2020 Third Quarter Financial Results


  • SaaS recurring revenue up 16% sequentially and 55% year over year


  • Six


    c


    onsecutive


    q


    uarters of


    c


    onsistent SaaS


    r


    ecurring


    r


    evenue


    g


    rowth

  • Highest level of quarterly Digital revenue, up 9% sequentially and 28% year over year

  • Completed


    a


    ccretive


    a


    cquisition of SoloFire, a leading platform for healthcare


    and life sciences


    sales enablement

  • VERB platform continues to gain traction and grow user downloads


    – now up to 1.65M

  • verbLIVE now fully integrated with Salesforce platform


    and available on Salesforce AppExchange


    – joint marketing campaign underway

  • Microsoft Outlook integration underway

  • verbTEAMS – a new entrepreneur and small business CRM with verbLIVE launches today

  • Several new hyper growth revenue catalysts


    to be


    revealed


    during scheduled earnings call

NEWPORT BEACH, Calif. and SALT LAKE CITY, Nov. 16, 2020 (GLOBE NEWSWIRE) — VERB Technology Company, Inc. (Nasdaq: VERB) (“VERB” or the “Company”), a leader in interactive video-based sales enablement applications, including interactive livestream ecommerce, webinar, CRM, and marketing applications for entrepreneurs and enterprises, today reported financial and operating results for the three months ended September 30, 2020. 

Management Commentary

“The third quarter continues what has been a tremendously successful 2020 for VERB,” said Rory J. Cutaia, CEO of VERB. “We’ve now delivered six consecutive quarters of SaaS revenue growth and we’re reporting our highest level of quarterly digital revenue to date. Our successful financial results reflect our continued focus on our higher-margin SaaS business applications.

“While our third quarter results demonstrate the continued growth in adoption and deployment of our verbCRM application among large sales enterprises, verbLIVE, our interactive video-based livestream ecommerce and webinar product, continues to draw significant interest, setting the stage for what we expect will be explosive revenue growth throughout 2021.

“We also successfully completed several strategic initiatives during the quarter. We completed the accretive acquisition of SoloFire, which gives us an immediate entry into the lucrative medical and life sciences sales market. We completed the integration of verbLIVE into the Salesforce platform. We also completed the inclusion of verbLIVE in the Salesforce AppExchange marketplace, expanding our distribution channels by making verbLIVE available to all Salesforce users. We significantly increased the number of user downloads both sequentially and year over year, and during today’s earnings call, we will announce several hyper-growth initiatives to drive revenue during the balance of this year and throughout 2021 and beyond,” Mr. Cutaia continued.

Thir
d Quarter
2020
and
Recent
Company
Highlights

  • Completed accretive acquisition of SoloFire, which develops and markets leading SaaS-based sales enablement applications for sales representatives of medical device, diagnostics and life sciences companies. With strong customer relationships and a proven product that increases sales productivity and marketing effectiveness, SoloFire’s natural strategic fit gives VERB an immediate entry into the lucrative medical and life sciences sales market, one of the largest and fastest growing markets for the sales enablement software industry.  
  • SaaS recurring revenue of approx. $1.5 million, up 16% over Q2 and up 55% from third quarter 2019.
  • Total Digital revenue of approx. $1.84 million, up almost 10% over Q2 and up 28% from third quarter 2019.
  • Total Non-Digital revenue of approx. $1.0 million, up almost 5% over Q2.
  • Total combined revenue of approx. $2.9 million, up almost 8% over Q2.
  • Added 16 new client contracts with a guaranteed base value of $834,000 and almost $500,000 in annual recurring revenue.
  • Six consecutive quarters of SaaS revenue growth.
  • On a pro forma basis, total SaaS revenue for the first nine months of 2020 was $4.5 million – up 33% from $3.4 million reported for the same period last year.
  • On a pro forma basis, total Digital revenue for the first nine months of 2020 was $5.7 million – an increase of almost 20% from $4.7 million reported for the same period last year.
  • Total user downloads now at 1.65M, up from approximately 1.49M reported in the second quarter 2020, and up from 720,000 for the same period last year.
  • Added Market America | SHOP.COM to growing roster of clients.
  • Completed the integration of livestream ecommerce application verbLIVE, with the platform of enterprise CRM giant Salesforce.
  • verbLIVE added to Salesforce’s AppExchange Partner Program.
  • Strengthened executive leadership team with appointments of Kym Nelson, Mitch Bledsoe and Julie Holdren.
  • VERB added to the Russell Microcap® Index as part of the 2020 Russell indexes annual reconstitution.
  • In July, VERB closed an underwritten public offering of common stock for gross proceeds of approximately $13.8 million, including full exercise of the underwriter’s over-allotment option to purchase additional shares.
  • Launched Verb For Humanity as part of a continuing and growing commitment to its ESG initiatives.

Financial Results


Three Months Ended September 30, 2020

  • Total Digital revenue was $1.8 million, an increase of 28% from the same quarter last year and an increase of almost 10% from the prior quarter.
  • Total SaaS recurring revenue (a component of total Digital revenue) was $1.5 million, an increase of 55% from the same period last year and increase of 16% from the prior quarter. SaaS recurring revenue as a percentage of total Digital revenue was 80%, compared with 66% for the same period last year.
  • Total revenue was $2.9 million, in line with revenue for the same period last year, but reflecting the Company’s strategic change in revenue mix with a substantially higher percentage of its revenue, approximately $400,000, coming from its digital applications business.
  • Cost of
    revenue was $1.3 million, a decrease of 12.5% from $1.5 million for the same period last year.
  • Research and development expenses were $2.4 million, almost double the $1.2 million for the same period last year. The increase was attributable to the development of verbLIVE and enhancements to verbCRM and VERB’s core platform to facilitate native integrations with Salesforce, Microsoft, and other channel partners.
  • General and administrative expenses were $6.7 million, approximately double the $3.3 million for the same period last year, reflecting increases in stock-based compensation expense and labor-related costs to support growth, as well as expenses related to the acquisition of SoloFire.
  • Cash totaled $10.7 million as at September 30, 2020, compared with $983,000 at December 31, 2019.

Conference Call
Information

VERB management will hold a conference call on Monday, November 16, 2020, at 5:30 PM Eastern time, to discuss its results in greater detail. A telephonic replay of the conference call is available from 8:30 PM Eastern time on the same day through November 30, 2020.

Live Call:

Date: Monday, November 16, 2020
Time: 5:30 PM Eastern time (2:30 PM Pacific time)
U.S. dial-in number: 1-877-407-4018
International number: 1-201-689-8471

Replay:

Toll-free replay number: 1-844-512-2921
International replay number: 1-412-317-6671
Replay ID: 13712506

The Company filed its Form 10-Q on November 16, 2020 and will file a transcript of the conference call on Form 8-K. These filings can be viewed in the Investor Relations section of VERB’s website.

About VERB

VERB Technology Company, Inc. (Nasdaq: VERB) transforms how businesses attract and engage customers. The Company’s Software-as-a-Service, or SaaS, platform is based on its proprietary interactive video technology, and comprises a suite of sales enablement business software products offered on a subscription basis. Its software applications are available in over 60 countries and in more than 48 languages to large enterprise and small business sales teams that need affordable, easy-to-use, and quick-to-get-results sales tools. Available in both mobile and desktop versions, the applications are offered as a fully integrated suite, as well as on a standalone basis, and include verbCRM (Customer Relationship Management application), verbLEARN (Learning Management System application), and verbLIVE (Interactive Livestream eCommerce and Video Webinar application). The Company has offices in California and Utah. For more information, please visit: www.verb.tech.

FORWARD LOOKING STATEMENTS

This press release contains forward-looking statements that involve risks and uncertainties. These forward-looking statements involve risks and uncertainties. If any of these risks or uncertainties materialize, or if any of our assumptions prove incorrect, our actual results could differ materially from the results expressed or implied by these forward-looking statements. These risks and uncertainties include risks associated with: the COVID-19 pandemic and related public health measures on our business, customers, markets and the worldwide economy; our plans to attract new customers, retain existing customers and increase our annual revenue; the development and delivery of new products, including verbLIVE; our plans and expectations regarding software-as-a-service offerings; our ability to execute on, integrate, and realize the benefits of any acquisitions; fluctuations in our quarterly results of operations and other operating measures; increasing competition; general economic, market and business conditions; and the risks described in the filings that we make with the Securities and Exchange Commission (“SEC”) from time to time, including the risks described under the headings “Risk Factors” and “Management Discussion and Analysis of Financial Condition and Results of Operations” in our Annual Report on Form 10-K, which was filed with the SEC on May 14, 2020, as amended by Amendment No. 1 on Form 10-K/A to our Annual Report on Form 10-K, which was filed with the SEC on June 4, 2020, and which should be read in conjunction with our financial results and forward-looking statements contained therein, and our Quarterly Report on Form 10-Q for the quarter ended September 30, 2020, which was filed with the SEC on November 16, 2020, and which should be read in conjunction with our financial results and forward-looking statements contained therein. All forward-looking statements in this press release are based on information available to us as of the date hereof, and we do not assume any obligation to update the forward-looking statements provided to reflect events that occur or circumstances that exist after the date on which they were made, except as required by law.

Investor Relations Contact:

888.504.9929
[email protected]

Media Contact:
855.250.2300, ext.107
[email protected]


Select Unaudited Pro Forma Performance Metrics By Quarter – as Filed
                 
          2019 2020    
  Q1 Q2 Q3 Q4   Q1 Q2 Q3
Total User Downloads 550,620 668,272 717,066 855,859   1,313,467 1,458,934 1,562,378
                 
SaaS Recurring Rev $       786,000 $       858,000 $       953,000 $       995,000 $      3,592,000 $   1,057,000 $   1,274,000 $   1,478,000
Other Digital 273,000 596,000 485,000 344,000 1,698,000 400,000 406,000 360,000
Total Digital Revenue $   1,059,000 $   1,454,000 $   1,438,000 $   1,339,000 $      5,290,000 $   1,457,000 $   1,680,000 $   1,838,000
                 
Welcome Kits & Fulfillment $   2,265,000 $   1,784,000 $   1,164,000 $       965,000 $      6,178,000 $       728,000 $       713,000 $       836,000
Shipping 677,000 495,000 271,000 181,000 1,624,000 169,000 259,000 186,000
Total Non-Digital Revenue $   2,942,000 $   2,279,000 $   1,435,000 $   1,146,000 $      7,802,000 $       897,000 $       972,000 $   1,022,000
                 
Total Combined Revenue  $   4,001,000 $   3,733,000 $   2,873,000 $   2,485,000 $   13,092,000 $   2,354,000 $   2,652,000 $   2,860,000
Digital Revenue as a % of
Total Combined Revenue
  26%   39%   50%   54%       62%   63%   64%


Surgalign Holdings and Aziyo Biologics Announce Expanded Distribution Agreement

Updated agreement expands availability of ViBone® Moldable, a next generation moldable cellular bone matrix product

DEERFIELD, Ill. and SILVER SPRING, Md., Nov. 16, 2020 (GLOBE NEWSWIRE) — Surgalign Holdings, Inc. (Nasdaq: SRGA), a global pure-play spine company focused on advancing spine surgery including through the application of digital technologies to improve patient outcomes, and Aziyo Biologics, Inc. (Nasdaq: AZYO), a commercial-stage regenerative medicine company, today announced an updated distribution agreement and expanded product offering whereby Aziyo will provide ViBone® Moldable to Surgalign for distribution in the U.S. ViBone Moldable joins Surgalign’s orthobiologic solutions to support spinal fusion, which currently include ViBone and other advanced bone graft solutions.

More about
ViBone
Moldable

Similar to ViBone, ViBone Moldable is a next-generation viable cell bone matrix processed using a proprietary method optimized to protect and preserve the health of native bone cells to potentially enhance new bone formation. It contains cancellous bone particles as well as demineralized cortical bone particles and fibers, delivering the necessary components for bone formation (osteoinduction, osteoconduction and osteogenesis) along with excellent handling and cohesive properties.

“We are excited about the addition of ViBone Moldable to Surgalign’s bone grafting solutions to enhance our surgeon customer experience. ViBone Moldable combines Aziyo’s expertise in viable cellular allograft bone matrix processing with handling enhancements for a better operating room experience,” said Terry Rich, President and Chief Executive Officer of Surgalign Holdings. “With this addition, Surgalign continues to focus on delivering innovative solutions for improved patient outcomes.”

“We are delighted to have the opportunity to expand our existing relationship with Surgalign, and to deliver the benefits of ViBone Moldable through their commercial organization,” said Ron Lloyd, President and CEO of Aziyo. “The orthopedic and spinal repair market is estimated to be a $2 billion market opportunity, with 1.5 million annual orthopedic and spinal repair procedures using biologic materials. We are confident that ViBone Moldable will be a great addition to the Surgalign portfolio of viable bone matrices addressing this significant market need.”

About Surgalign Holdings, Inc.

Surgalign Holdings, Inc. is a global medical technology company advancing the science of spine care, focused on delivering innovative solutions that drive superior clinical and economic outcomes. The company is building off a legacy of high quality and differentiated products, and continues to invest in clinically validated innovation to deliver better surgical outcomes and improve patient’s lives. Surgalign markets products throughout the United States and in more than 50 countries worldwide through an expanding network of top independent distributors. Surgalign, a member of AdvaMed, is headquartered in Deerfield, IL, with commercial, innovation and design centers in San Diego, CA, Marquette, MI, and Wurmlingen, Germany. Learn more at www.surgalign.com and connect on LinkedIn and Twitter.

About Aziyo Biologics

Aziyo Biologics is a commercial-stage regenerative medicine company focused on creating the next generation of differentiated products and improving outcomes in patients undergoing surgery, concentrating on patients receiving implantable medical devices. Since its founding in 2015, Aziyo Biologics has created a portfolio of commercial-stage products used in cardiovascular, orthopedic, and reconstructive specialties. For more information, visit www.Aziyo.com.

Forward Looking Statement

This communication contains forward-looking statements within the meaning of the Private Securities Litigation Reform Act of 1995, including statements regarding the addressable market and Surgalign’s and Aziyo’s ability to satisfy this need. These forward-looking statements are based on Surgalign’s and Aziyo’s management’s current expectations, estimates and projections about their industry, their respective management’s beliefs and certain assumptions made by such management. Words such as “anticipates,” “expects,” “intends,” “plans,” “believes,” “seeks,” “estimates,” “will” and variations of such words and similar expressions are intended to identify such forward-looking statements. These statements are not guarantees of future performance and are subject to risks and uncertainties, including the risks described in Surgalign’s and Aziyo’s public filings with the U.S. Securities and Exchange Commission including, but not limited to, those described under the section entitled “Risk Factors” of such filings. Any such forward-looking statements speak as of the date of this press release. Actual results may differ materially from the anticipated results reflected in these forward-looking statements. Except as required by applicable law, neither Surgalign nor Aziyo undertake any obligation to publicly update or revise any forward-looking statements contained herein, whether as a result of any new information, future events, changed circumstances or otherwise.

Surgalign Investor Contact:   Aziyo Investor Contact:   Aziyo Media Contact:
Jonathon Singer   Leigh Salvo or Caroline Paul   Courtney Guyer
Investor and Media Contact   Gilmartin Group   Aziyo Biologics, Inc.
[email protected]   [email protected]   [email protected]
+1 224 303 4651        


PLx Pharma Inc. Reports Third Quarter 2020 Results and Provides Business Update

–Announces $18 million private placement–

–Submitted sNDAs for VAZALORE 325 mg and 81 mg doses to FDA end of October–

–On target for third quarter 2021 commercial launch of VAZALORE–

SPARTA, N.J., Nov. 16, 2020 (GLOBE NEWSWIRE) — PLx Pharma Inc. (NASDAQ: PLXP) (“PLx” or the “Company”), a late-stage specialty pharmaceutical company focused on its clinically-validated and patent-protected PLxGuard™ drug delivery platform to provide more effective and safer products, with its lead products VAZALORE™ 325 mg and VAZALORE™ 81 mg (referred to together as “VAZALORE”), announced today certain financial and operational results for the three and nine months ended September 30, 2020.

Highlights of, and certain events subsequent to, the third quarter of 2020 include:

  • Entered into an $18 million private placement with investors led by White Rock Capital Management, L.P. and Level One Partners, LLC;
  • Submitted supplemental New Drug Applications (“sNDAs”) for VAZALORE 325 mg and 81 mg doses to the U.S. Food and Drug Administration (“FDA”) for regulatory approval at the end of October ahead of previously announced timeline; and
  • Targeting commercial launch of both VAZALORE 325 mg and 81 mg doses for the third quarter of 2021, assuming FDA approval, adequate capital funding and no COVID-related delays.

“The submission of our two sNDAs marks a significant milestone for PLx in our efforts to bring VAZALORE, our novel aspirin therapy to market. While VAZALORE is under regulatory review, we will continue our precommercial activities focused on specialists treating vascular disease, retailers and consumers. Our upcoming priorities are to execute our commercial strategy for a successful product launch that will bring this much-needed aspirin alternative to the millions of at-risk patients,” said Natasha Giordano, President and Chief Executive Officer of PLx.

Private Placement

On November 16, 2020, the Company entered into a securities purchase agreement for the sale of units comprised of shares of common stock and a warrant to purchase shares of common stock in a private placement that will result in gross proceeds to the Company of approximately $18 million, before deducting placement agent and other offering expenses, for the issuance of 4,755,373 shares of common stock and warrants to purchase up to an additional 5,230,910 shares of common stock for a per unit price of $3.787. The private placement is expected to close on or prior to November 18, 2020. The warrants will become exercisable on the date of issuance, have an exercise price of $4.31 per share and will expire five years from the date of issuance.

“We are pleased to be leading the financing in support of PLx and VAZALORE, as the Company advances its innovative aspirin product through the regulatory process and prepares for market entry. With management’s extensive experience launching large, commercially successful products, we are confident in PLx’s ability to execute its strategic plan and to take full advantage of the significant market opportunity for VAZALORE,” stated Tom Barton, White Rock Capital Management, L.P.

Third
Quarter 20
20
Financial
Results

The Company recognized no revenue for the three months ended September 30, 2020, compared to revenue of $41,106 for the three months ended September 30, 2019. Revenue in the 2019 period is attributable to work performed under a federal grant from the National Institutes of Health (“NIH”), which came to an end in the second quarter of 2020.

Research and development expense totaled $1.2 million in the three months ended September 30, 2020 and 2019. The expense in the 2020 period includes clinical-related spending for the bioequivalence study combined with pre-validation manufacturing costs. The prior year period included manufacture and packaging costs for the VAZALORE registration batches.

General and administrative expenses totaled $2.0 million in the three months ended September 30, 2020, compared to $2.5 million in the prior year period. The decrease primarily reflects lower compensation-related expenses combined with reduced spending on conferences and related travel due to COVID-19 restrictions.

Other income (expense), net, totaled $61,847 and $5.4 million of net other income in the three months ended September 30, 2020 and 2019, respectively. The decrease is largely attributable to the non-cash change in fair value of warrant liability primarily due to the fluctuation of the price of the Company’s common stock, combined with lower net interest expense, which was impacted by a lower principal debt balance and lower interest rates.

Net loss attributable to common stockholders for the third quarter of 2020 was $3.6 million, or ($0.40) per basic and diluted share, compared to net income of $1.4 million, or $0.09 per share, for the third quarter of 2019. The third quarter of 2020 includes non-cash income of $134,552, or $0.01 per share, related to the change in fair value of warrant liability and $0.5 million, or ($0.05) per share, of Series A and Series B convertible preferred stock dividends. The third quarter of 2019 included non-cash income of $5.5 million, or $0.55 per share, related to the change in the warrant liability and $0.3 million, or ($0.03) per share, for preferred stock dividends related to the Series A convertible preferred stock.

Nine Months Ended September 30
, 2020
Financial Results

For the nine months ended September 30, 2020, revenue was $30,430 compared to $541,571 in the comparable period in 2019. All the revenue recognized is attributable to work performed under an award of an NIH grant, which came to an end in the second quarter of 2020.

Research and development expense decreased to $3.1 million for the nine months ended September 30, 2020, compared to $3.8 million for the first nine months of 2019. The decrease is due to lower manufacturing-related activities for VAZALORE, as the prior year included the manufacture and packaging of the registration batches. The decrease also reflects lower reimbursable grant expenses, as the grant from the NIH came to an end in the second quarter 2020. Higher clinical-related spending, primarily for the bioequivalence study, partially offset this decrease.  

General and administrative expense totaled $6.7 million for the nine months ended September 30, 2020, compared to $7.2 million in the comparable 2019 period. The decrease was due to compensation-related expense and reduced spending on conferences and related travel due to COVID-19 restrictions, offset somewhat by higher spending on pre-launch marketing activities and higher stock compensation expense.

Other income (expense), net was $2.5 million of net other income for the first nine months of 2020, compared to $8.1 million of net other expense for the first nine months of 2019. The difference is largely attributable to the non-cash change in fair value of warrant liability, primarily due to the fluctuation of the price of the Company’s common stock, combined with lower net interest expense due to lower interest rates and a lower principal debt balance.

Net loss attributable to common stockholders for the nine months ended September 30, 2020 was $8.5 million, or ($0.92) per share, compared to net loss attributable to common stockholders of $31.9 million, or ($3.60) per share, for the first nine months of 2019. The first nine months of 2020 included non-cash income of $2.8 million, or $0.31 per share, as a result of a change in the fair value of the warrant liability and $1.2 million of Series A and Series B convertible preferred stock dividends. The first nine months of 2019 included a charge of $13.4 million, or ($1.52) per share, for the beneficial conversion feature and dividends related to the Series A convertible preferred stock. The first nine months of 2019 also included a non-cash charge of $7.6 million, or ($0.86) per share, as a result of a change in the fair value of the warrant liability.

As of September 30, 2020, cash and cash equivalents were $9.1 million.

Conference Call

As previously announced, PLx management will host its third quarter 2020 conference call as follows:

Date: Monday, November 16, 2020
   
Time: 4:30 p.m. ET
   
Toll free (U.S.): (866) 394-2901
   
International: (616) 548-5567
   
Webcast (live and replay): www.plxpharma.com under the ‘Investor Relations’ section.

The archived webcast will be available for 30 days via the aforementioned URL.

About
VAZAL
ORE

VAZALORE 325 mg is an FDA-approved liquid-filled aspirin capsule that provides patients with vascular disease and diabetic patients who are candidates for aspirin therapy with faster, reliable and more predictable platelet inhibition as compared to enteric-coated aspirin, while also reducing the risk of stomach erosions and ulcers, as compared to immediate-release aspirin, common in an acute setting. PLx’s supplemental New Drug Applications for VAZALORE 325 mg and VAZALORE 81 mg doses, submitted in October 2020 to the FDA, are currently under regulatory review.

About PLx Pharma Inc.

PLx Pharma Inc. is a late-stage specialty pharmaceutical company focused on its clinically-validated and patent-protected PLxGuard™ drug delivery platform to provide more effective and safer products. The PLxGuard drug delivery platform works by targeting the release of active pharmaceutical ingredients to various portions of the gastrointestinal (GI) tract. PLx believes this has the potential to improve the absorption of many drugs currently on the market or in development, and to reduce the risk of stomach erosions and ulcers associated with aspirin and ibuprofen, and potentially other drugs.

To learn more about PLx Pharma Inc. and its pipeline, please visit www.plxpharma.com.

Forward-Looking Statements

Any statements made in this press release relating to future financial or business performance, conditions, plans, prospects, trends, or strategies and other financial and business matters, including without limitation, the prospects for commercializing or selling any products or drug candidates are forward-looking statements within the meaning of the Private Securities Litigation Reform Act of 1995. In addition, when or if used in this press release, the words “may,” “could,” “should,” “anticipate,” “believe,” “estimate,” “expect,” “intend,” “plan,” “predict” and similar expressions and their variants, as they relate to PLx may identify forward-looking statements. PLx cautions that these forward-looking statements are subject to numerous assumptions, risks, and uncertainties, which change over time. Important factors that may cause actual results to differ materially from the results discussed in the forward-looking statements or historical experience include risks and uncertainties, including the failure by PLx to secure and maintain relationships with collaborators; risks relating to clinical trials; risks relating to the commercialization, if any, of PLx’s proposed product candidates (such as marketing, regulatory, product liability, supply, competition, and other risks); dependence on the efforts of third parties; dependence on intellectual property, risks that PLx may lack the financial resources and access to capital to fund proposed operations. Further information on the factors and risks that could affect PLx’s business, financial conditions and results of operations are contained in PLx’s filings with the U.S. Securities and Exchange Commission (“SEC”), which are available at www.sec.gov. Other risks and uncertainties are more fully described in PLx’s Form 10-K for the year ended December 31, 2019 filed with the SEC on March 13, 2020, and in other filings that PLx has made or will make going forward. The forward-looking statements represent PLx’s estimate as of the date hereof only, and PLx specifically disclaims any duty or obligation to update forward-looking statements.

Contact
Investor Relations:
Lisa M. Wilson, In-Site Communications, Inc.
T: 212-452-2793
E: [email protected]

Source: PLx Pharma Inc.

FINANCIAL TABLES FOLLOW

       
PLx Pharma Inc.
UNAUDITED CONSOLIDATED BALANCE SHEETS
       
  September 30, 2020   December 31, 2019
ASSETS      
CURRENT ASSETS      
Cash and cash equivalents $            9,086,525     $            14,001,304  
Accounts receivable                             –                             18,683  
Inventory, net                   143,380                                  –    
Prepaid expenses and other current assets                   387,801                         263,268  
TOTAL CURRENT ASSETS                9,617,706                    14,283,255  
NON-CURRENT ASSETS      
Property and equipment, net                1,252,434                      1,466,646  
Right of use assets                   402,640                         618,158  
Goodwill                2,061,022                      2,061,022  
Security deposit                     17,035                           73,665  
TOTAL ASSETS $          13,350,837     $            18,502,746  
         
LIABILITIES, SERIES A AND SERIES B CONVERTIBLE PREFERRED STOCK AND STOCKHOLDERS’ EQUITY (DEFICIT)      
CURRENT LIABILITIES        
Accounts payable and accrued liabilities $               612,367     $                 928,921  
Accrued bonuses                   718,092                      1,166,821  
Accrued interest                   589,840                           34,964  
Current portion of term loan, net of discount and fees                1,548,865                      3,658,121  
Other current liabilities                   342,175                         304,603  
TOTAL CURRENT LIABILITIES                3,811,339                      6,093,430  
NON-CURRENT LIABILITIES      
Accrued interest, net of current portion                             –                           501,826  
Term loan, net of discount, fees and current portion                             –                           622,265  
Warrant liability                5,442,717                      8,247,679  
Accrued dividends                2,285,920                      1,058,498  
Other liabilities                   146,424                         409,431  
TOTAL LIABILITIES              11,686,400                    16,933,129  
         
Series A convertible preferred stock: $0.001 par value; liquidation value of $17,042,322; 45,000 shares authorized, 15,000  issued and outstanding              13,661,578                    13,661,578  
Series B convertible preferred stock: $0.001 par value; liquidation value of $8,243,598; 25,000 shares authorized, 8,000 and 0 issued and outstanding                7,723,312                                  –    
       
STOCKHOLDERS’ EQUITY (DEFICIT)       
Preferred stock; $0.001 par value; 930,000 shares authorized; none issued and outstanding                             –                                    –    
Common stock; $0.001 par value; 100,000,000 shares authorized; 9,156,260 shares issued and outstanding                        9,156                             9,156  
Additional paid-in capital              74,437,924                    74,837,046  
Accumulated deficit            (94,167,533 )                (86,938,163 )
TOTAL STOCKHOLDERS’ EQUITY (DEFICIT)            (19,720,453 )                (12,091,961 )
TOTAL LIABILITIES, SERIES A AND SERIES B CONVERTIBLE PREFERRED STOCK AND STOCKHOLDERS’ EQUITY (DEFICIT) $          13,350,837     $            18,502,746  


PLx Pharma Inc.
UNAUDITED CONSOLIDATED STATEMENTS OF OPERATIONS
           
  Three Months Ended September 30,   Nine Months Ended September 30,
    2020       2019       2020       2019  
REVENUES:              
Federal grant $     $ 41,106     $ 30,430     $ 541,571  
TOTAL REVENUES         41,106       30,430       541,571  
               
OPERATING EXPENSES:              
Research and development   1,207,302       1,214,029       3,116,097       3,805,617  
General and administrative   1,981,037       2,503,314       6,681,452       7,180,674  
TOTAL OPERATING EXPENSES   3,188,339       3,717,343       9,797,549       10,986,291  
OPERATING LOSS   (3,188,339 )     (3,676,237 )     (9,767,119 )     (10,444,720 )
               
OTHER INCOME (EXPENSE):              
Interest and other expense, net   (72,705 )     (118,432 )     (267,213 )     (476,084 )
Change in fair value of warrant liability   134,552       5,498,391       2,804,962       (7,581,521 )
TOTAL OTHER INCOME (EXPENSE)   61,847       5,379,959       2,537,749       (8,057,605 )
(LOSS) INCOME BEFORE INCOME TAXES   (3,126,492 )     1,703,722       (7,229,370 )     (18,502,325 )
Income taxes                      
NET (LOSS) INCOME   (3,126,492 )     1,703,722       (7,229,370 )     (18,502,325 )
               
Preferred dividends and beneficial conversion feature   (499,797 )     (311,136 )     (1,227,422 )     (13,433,397 )
NET (LOSS) INCOME ATTRIBUTABLE TO COMMON STOCKHOLDERS $ (3,626,289 )   $ 1,392,586     $ (8,456,792 )   $ (31,935,722 )
               
Net (loss) income per common share – basic $ (0.40 )   $ 0.09     $ (0.92 )   $ (3.60 )
Net (loss) income per common share – diluted $ (0.40 )   $ 0.09     $ (0.92 )   $ (3.60 )
               
Weighted average shares of common shares – basic   9,156,260       8,921,345       9,156,260       8,860,168  
Weighted average shares of common shares – diluted   9,156,260       8,936,255       9,156,260       8,860,168  


SmileDirectClub Reports Third Quarter 2020 Financial Results

NASHVILLE, Tenn., Nov. 16, 2020 (GLOBE NEWSWIRE) — SmileDirectClub, Inc. (Nasdaq: SDC) today announced its financial results for the third quarter ended September 30, 2020.

Third Quarter 2020 Financial Highlights

  • Third quarter total revenue of $169 million.
  • Third quarter net loss of $(43) million.
  • Third quarter Adjusted EBITDA of $3 million.
  • Third quarter diluted EPS of $(0.11).

Key Operating Metrics

  • Third quarter 2020 unique aligner shipments of 93,301.
  • Average aligner gross sales price (“ASP”) of $1,794 for the third quarter of 2020, compared to $1,788 for the third quarter of 2019.
  • Adjusted EBITDA of $3 million for the third quarter of 2020, compared to $(45) million for the third quarter of 2019, an improvement of 106.7%.

“Our performance in Q3 was continued validation of the strength of our business model, and the power of the competitive moats around our platform. It also demonstrated our continued focus on controlled growth with profitability. We outlined this strategy in the fourth quarter of 2019, and we have been executing against it in the three quarters since,” said SmileDirectClub Chief Executive Officer David Katzman.

SmileDirectClub Chief Financial Officer Kyle Wailes added, “Similar to the second quarter, the flexibility and scalability of our business model served us well, allowing us to make meaningful progress against our growth initiatives, alongside advancements on the cost side driving Adjusted EBITDA profitability one quarter ahead of our plan.”

Business Outlook

The Company remains laser focused on providing the best Club Member experience, while driving controlled and profitable growth. Within the third quarter, the Company made meaningful progress against this plan and the associated future growth drivers; specifically, expanding the core customer acquisition channels, extending the value proposition to the teen demographic, and international expansion. On the cost side, the Company turned AEBITDA profitable one quarter ahead of plan through continued advancement in automating its manufacturing and treatment planning operations, continued discipline around the deployment of marketing and selling dollars, and ongoing cost discipline across the business.

The Company expects to continue to see favorable industry dynamics with broader acceptance of telehealth and specifically teledentistry, minimal penetration against the total addressable market, no real competitor that provides an end-to-end vertically integrated platform for the consumer, and clear aligners gaining share in the overall industry. The Company would expect these dynamics to accrue to more efficient customer acquisition costs, as the Company continues to execute against its 20-30% annualized revenue growth targets.

As the low-cost provider with brand presence and no pricing pressure, and in an increasingly favorable climate for telehealth, the Company is well positioned to continue to gain share in the massively underserved market for clear aligners.

Conference Call Information

SmileDirectClub
Third Quarter 2020 Conference Call Details
   
Date: November 16, 2020
Time: 4:30 p.m. ET (1:30 p.m. PT)
Dial-In:  1-877-407-9208 (domestic) or 1-201-493-6784 (international)
Webcast:  Visit “Events and Presentations” section of the company’s IR page at http://investors.smiledirectclub.com

A replay of the call may be accessed from 7:30 p.m. ET on Monday, November 16, 2020 until 11:59 pm ET on Monday, November 30, 2020 by dialing 1-844-512-2921 (domestic) or 1-412-317-6671 (international) and entering the replay PIN: 13711961. An archived version of the call and a copy of the 2020 third quarter results supplemental earnings presentation will also be available upon completion on the Investor Relations section of SmileDirectClub’s website at investors.smiledirectclub.com.

Forward-Looking Statements

This earnings release contains forward-looking statements. All statements other than statements of historical facts may be forward-looking statements. Forward-looking statements generally relate to future events and include, without limitation, projections, forecasts and estimates about possible or assumed future results of our business, financial condition, liquidity, results of operations, plans, and objectives. Some of these statements may include words such as “expects,” “anticipates,” “believes,” “estimates,” “targets,” “plans,” “potential,” “intends,” “projects,” and “indicates.”

Although they reflect our current, good faith expectations, these forward-looking statements are not a guarantee of future performance, and involve a number of risks, uncertainties, estimates, and assumptions, which are difficult to predict. Some of the factors that may cause actual outcomes and results to differ materially from those expressed in, or implied by, the forward-looking statements include, but are not necessarily limited to: the duration and magnitude of the COVID-19 pandemic and related containment measures; our management of growth; the execution of our business strategies, implementation of new initiatives, and improved efficiency; our sales and marketing efforts; our manufacturing capacity, performance, and cost; our ability to obtain future regulatory approvals; our financial estimates and needs for additional financing; consumer acceptance of and competition for our clear aligners; our relationships with retail partners and insurance carriers; our R&D, commercialization, and other activities and expenditures; the methodologies, models, assumptions, and estimates we use to prepare our financial statements, make business decisions, and manage risks; laws and regulations governing remote healthcare and the practice of dentistry; our relationships with vendors; the security of our operating systems and infrastructure; our risk management framework; our cash and capital needs; our intellectual property position; our exposure to claims and legal proceedings; and other factors described in our filings with the Securities and Exchange Commission, including but not limited to our Annual Report on Form 10-K for the year ended December 31, 2019 and our Quarterly Report on Form 10-Q for the quarter ended September 30, 2020.

New risks and uncertainties arise over time, and it is not possible for us to predict all such factors or how they may affect us. You should not place undue reliance on forward-looking statements, which speak only as of the date they are made. We are under no duty to update any of these forward-looking statements after the date of this earnings release to conform these statements to actual results or revised expectations. You should, therefore, not rely on these forward-looking statements as representing our views as of any date subsequent to the date of this earnings release.

About
SmileDirectClub

SmileDirectClub, Inc. (Nasdaq: SDC) (“SmileDirectClub”) is an oral care company and creator of the first MedTech platform for teeth straightening, now also offered directly via dentist and orthodontists’ offices. Through our cutting-edge teledentistry technology and vertically integrated model, we are revolutionizing the oral care industry, from clear aligner therapy to our affordable, premium oral care product line. SmileDirectClub’s mission is to democratize access to a smile each and every person loves by making it affordable and convenient for everyone. SmileDirectClub is headquartered in Nashville, Tennessee and operates in the U.S., Canada, Australia, New Zealand, United Kingdom, Ireland, Germany, Austria, Hong Kong, Singapore and Spain. For more information, please visit SmileDirectClub.com.

Investor Relations:

Alison Sternberg
Vice President, Investor Relations
[email protected]

Media Relations:

Kim Atkinson
Vice President, Communications
[email protected]

SmileDirectClub
, Inc.

Consolidated Balance Sheets

(in thousands)

  September 30,

2020
December 31,

2019
ASSETS    
Cash and cash equivalents $ 373,045     $ 318,458  
Accounts receivable 230,244     239,413  
Inventories 26,101     18,431  
Prepaid and other current assets 15,337     14,186  
Total current assets 644,727     590,488  
Accounts receivable, non-current 71,729     106,315  
Property, plant and equipment, net 183,430     177,543  
Operating lease right-of-use asset 30,564      
Other assets 11,461     11,299  
Total assets $ 941,911     $ 885,645  
LIABILITIES AND PERMANENT EQUITY              
Accounts payable $ 35,863     $ 52,706  
Accrued liabilities 93,308     93,339  
Deferred revenue 51,851     25,435  
Current portion of long-term debt 24,398     35,376  
Other current liabilities 6,452      
Total current liabilities 211,872     206,856  
Long-term debt, net of current portion 391,283     173,150  
Operating lease liabilities, net of current portion 32,038      
Other long-term liabilities 43,400     47,354  
Total liabilities 678,593     427,360  
Commitment and contingencies    
Permanent Equity    
Class A common stock, par value $0.0001 and 113,105,780 shares issued and outstanding at September 30, 2020 and 103,303,674 shares issued and outstanding at December 31, 2019 11     10  
Class B common stock, par value $0.0001 and 272,787,403 shares issued and outstanding at September 30, 2020 and 279,474,505 shares issued and outstanding at December 31, 2019 27     28  
Additional paid-in-capital 479,419     447,866  
Accumulated other comprehensive income (loss) 59     (272 )
Accumulated deficit (183,152 )   (114,513 )
Noncontrolling interest (50,666 )   125,166  
Warrants 17,620      
Total permanent equity 263,318     458,285  
Total liabilities and permanent equity $ 941,911     $ 885,645  
               

SmileDirectClub
, Inc.

Consolidated Statements of Operations

(in thousands, except share and per share amounts)

  Three Months Ended
September 30,
Nine Months Ended
September 30,
  2020 2019 2020 2019
Revenue, net $ 156,459     $ 168,663     $ 434,796     $ 522,529  
Financing revenue 12,042     11,522     37,428     31,185  
Total revenues 168,501     180,185     472,224     553,714  
Cost of revenues 49,760     39,125     158,313     111,363  
Cost of revenues—related parties     2,310         13,652  
Total cost of revenues 49,760     41,435     158,313     125,015  
Gross profit 118,741     138,750     313,911     428,699  
Marketing and selling expenses 66,722     131,263     243,564     340,409  
General and administrative expenses 74,110     389,828     233,828     486,319  
Lease abandonment and impairment of long-lived assets 3,960         28,593      
Other store closure and related costs 1,714         6,190      
Loss from operations (27,765 )   (382,341 )   (198,264 )   (398,029 )
Interest expense 15,555     4,291     29,627     11,607  
Interest expense—related parties             75  
Loss on extinguishment of debt     32     13,781     29,672  
Other (income) expense (1,028 )   421     2,131     500  
Net loss before income tax expense (42,292 )   (387,085 )   (243,803 )   (439,883 )
Income tax expense 1,190     479     1,745     596  
Net loss (43,482 )   (387,564 )   (245,548 )   (440,479 )
Net loss attributable to noncontrolling interest (30,892 )   (299,268 )   (176,909 )   (352,183 )
Net loss attributable to SmileDirectClub, Inc. $ (12,590 )   $ (88,296 )   $ (68,639 )   $ (88,296 )
         
Earnings per share of Class A common stock:        
Basic $ (0.11 )   $ (0.89 )   $ (0.63 )   $ (0.89 )
Diluted $ (0.11 )   $ (0.89 )   $ (0.64 )   $ (0.89 )
         
Weighted average shares outstanding:        
Basic 111,703,080     99,533,877     108,459,488     99,533,877  
Diluted 385,672,677     379,008,382     384,888,849     379,008,382  
                       

SmileDirectClub
, Inc.

Consolidated Statements of Cash Flows

(in thousands)

  Nine Months Ended September 30,
  2020 2019
Operating Activities    
Net loss $ (245,548 )   $ (440,479 )
Adjustments to reconcile net loss to net cash used in operating activities:    
Depreciation and amortization 39,399     16,237  
Deferred loan cost amortization 3,021     1,496  
Equity-based compensation 38,189     332,759  
Loss on extinguishment of debt 13,594     17,693  
Paid in kind interest expense 5,118      
Lease abandonment, impairment of long-lived assets and other store closure and related charges 30,903      
Changes in ROU asset 5,797      
Other non-cash operating activities     1,783  
Changes in operating assets and liabilities:    
Accounts receivable 43,755     (137,509 )
Inventories (8,456 )   (5,852 )
Prepaid and other current assets (2,844 )   (6,205 )
Accounts payable (9,441 )   (4,475 )
Accrued liabilities (8,559 )   45,880  
Due to related parties     (19,177 )
Deferred revenue 26,416     5,834  
Net cash used in operating activities (68,656 )   (192,015 )
Investing Activities    
Purchases of property, equipment, and intangible assets (68,768 )   (66,355 )
Net cash used in investing activities (68,768 )   (66,355 )
Financing Activities    
Payment of IPO related costs (1,155 )   1,285,759  
Proceeds from warrant exercise 922      
Repurchase of Class A shares and related fees     (696,489 )
Repurchase of Class A shares to cover employee tax withholdings (6,976 )   (81,603 )
Settlement of canceled awards —      (2,000 )
Issuance of Class A common stock     6  
Proceeds from HPS Credit Facility and Warrants, net 388,000      
Borrowings on long-term debt 16,807     176,000  
Payments of loan costs (11,784 )   (6,127 )
Principal payments on long-term debt (187,579 )   (159,047 )
Principal payments on related party debt     (24,581 )
Payments on finance leases (7,543 )    
Other 1,319     86  
Net cash provided by financing activities 192,011     492,004  
Increase in cash and cash equivalents 54,587     233,634  
Cash and cash equivalents at beginning of period 318,458     313,929  
Cash and cash equivalents at end of period $ 373,045     $ 547,563  
               

Use of Non-GAAP Financial Measures

This earnings release contains certain non-GAAP financial measures, including adjusted EBITDA (“Adjusted EBITDA”). We provide a reconciliation of this non-GAAP financial measure to the most directly comparable GAAP financial measure below and in our Current Report on Form 8-K announcing our quarterly earnings results, which can be found on the SEC’s website at www.sec.gov and our website at investors.smiledirectclub.com.

We utilize certain non-GAAP financial measures, including Adjusted EBITDA, to evaluate our actual operating performance and for planning and forecasting of future periods.

We define Adjusted EBITDA as net loss plus depreciation and amortization, interest expense, income tax expense, equity-based compensation, impairment of long-lived assets, abandonment and other related charges, and certain other non-operating expenses such as one-time store closure costs associated with our real estate repositioning strategy, severance and other labor costs, and unrealized foreign currency adjustments. We use Adjusted EBITDA when evaluating our performance when we believe that certain items are not indicative of operating performance. Adjusted EBITDA provides useful supplemental information to management regarding our operating performance and we believe it will provide the same to members/stockholders.

We believe that Adjusted EBITDA will provide useful information to members/stockholders about our performance, financial condition, and results of operations for the following reasons: (i) Adjusted EBITDA would be among the measures used by our management team to evaluate our operating performance and make day-to-day operating decisions and (ii) Adjusted EBITDA is frequently used by securities analysts, investors, lenders, and other interested parties as a common performance measure to compare results or estimate valuations across companies in our industry.

Adjusted EBITDA does not have a definition under GAAP, and our definition of Adjusted EBITDA may not be the same as, or comparable to, similarly titled measures used by other companies. Adjusted EBITDA should not be considered in isolation from, or as a substitute for, financial information prepared in accordance with GAAP. A reconciliation of Adjusted EBITDA to net loss, the most directly comparable GAAP financial measure, is set forth below.

SmileDirectClub
, Inc.

Reconciliation of Net Loss to Adjusted EBITDA

(in thousands)

  Three Months Ended
September 30,
Nine Months Ended
September 30,
  2020 2019 2020 2019
  (unaudited)
Net loss $ (43,482 )   $ (387,564 )   $ (245,548 )   $ (440,479 )
Depreciation and amortization 14,042     6,514     39,399     16,237  
Total interest expense 15,555     4,291     29,627     11,682  
Income tax expense 1,190     479     1,745     596  
Lease abandonment and impairment of long-lived assets 3,960         28,593      
Other store closure and related costs 1,714         6,190      
Loss on extinguishment of debt     32     13,781     29,672  
Equity-based compensation 10,972     324,497     38,189     332,759  
IPO related costs     6,146         6,146  
Other non-operating general and administrative (gains) losses (930 )   421     3,775     502  
Adjusted EBITDA $ 3,021     $ (45,184 )   $ (84,249 )   $ (42,885 )