SVB Financial Group Confirms Date And Time Of Quarterly Earnings Call

PR Newswire

SANTA CLARA, Calif., Jan. 11, 2021 /PRNewswire/ — SVB Financial Group (NASDAQ: SIVB) will report its financial results for the quarter ended December 31, 2020, on Thursday, January 21, 2021 after the close of the stock market.  

The Company will file its quarterly financial results with the SEC via form 8-K and issue an advisory release via newswire containing a link to its full financial results, which will be also posted on the Investor Relations section of its website at www.svb.com. 

Conference call: 
Thursday, January 21, 2021 at 3:00 p.m. Pacific Time

Dial-in information: (833) 494-1484 or (236) 714-2618, Confirmation 9766735

Live audio webcast:  A live audio webcast of the call can be accessed via SVB’s investor relations website at http://ir.svb.com

Replay: An audio replay of the call will be available at http://ir.svb.com for 12 months beginning January 21, 2021

2021 Quarterly Earnings Announcements: The Company expects to release quarterly results for 2021 on the following dates, which are subject to change:


QUARTER


RELEASE DATE

First quarter 2021 results

Thursday April 22, 2021

Second quarter 2021 results

Thursday, July 22, 2021

Third quarter 2021 results

Thursday, October 21, 2021

Fourth quarter and full year 2021 results

Thursday, January 27, 2022

The Company expects to issue an advisory release confirming the date of each quarterly announcement and call approximately 2 weeks prior to the scheduled announcement date.

About SVB Financial Group
For more than 35 years, SVB Financial Group (NASDAQ: SIVB) and its subsidiaries have helped innovative companies and their investors move bold ideas forward, fast. SVB Financial Group’s businesses, including Silicon Valley Bank, offer commercial and private banking, asset management, private wealth management, brokerage and investment services and funds management services to companies in the technology, life science and healthcare, private equity and venture capital, and premium wine industries. Headquartered in Santa Clara, California, SVB Financial Group operates in centers of innovation around the world. Learn more at svb.com.

SVB Financial Group is the holding company for all business units and groups © 2021 SVB Financial Group. All rights reserved. SVB, SVB FINANCIAL GROUP, SILICON VALLEY BANK, MAKE NEXT HAPPEN NOW and the chevron device are trademarks of SVB Financial Group, used under license. Silicon Valley Bank is a member of the FDIC and the Federal Reserve System. Silicon Valley Bank is the California bank subsidiary of SVB Financial Group. [SIVB-F]

Cision View original content:http://www.prnewswire.com/news-releases/svb-financial-group-confirms-date-and-time-of-quarterly-earnings-call-301205653.html

SOURCE SVB Financial Group

Atlantic Broadband Launches WiFi Your Way™, Powered by Plume HomePass®

Atlantic Broadband Launches WiFi Your Way™, Powered by Plume HomePass®

Next generation technology delivers phenomenal in-home WiFi experience

QUINCY, Mass.–(BUSINESS WIRE)–Atlantic Broadband, the eighth-largest cable operator in the U.S., today announced that it has launched WiFi Your WayTM, a best-in-class managed home WiFi solution powered by Plume HomePass® that will provide expanded WiFi coverage with enhanced reliability and superfast speed in every area of the home.

The new service, which uses Plume’s cloud-based artificial intelligence (AI) technology and is accessed via the WiFi Your Way App, features:

  • AdaptTMcontinually learns and self-optimizes proactively to deliver greater speed and coverage throughout the home.
  • ControlTMprovides intuitive tools for personalization, allowing the user to set guest and child access controls (including age-appropriate content filters).
  • Speed Test capabilities are built-in so customers can easily monitor internet speed and performance.
  • GuardTM provides best-in-class online security powered by AI that detects and protects in real time. The system halts suspicious activity, blocks ad and malware and quarantines any compromised devices.
  • SenseTM uses WiFi-connected devices to provide whole-home motion awareness in real time for peace of mind and among many use-cases, provides alerts if there is motion when a customer is out of the home.

The WiFi Your Way App (for iOS and Android devices) guides customers through an easy self-installation of SuperPods, which plug into a wall outlet to provide superfast whole-home coverage. The SuperPods work with any Atlantic Broadband gateway or modem. Customers lease the SuperPods rather than purchase them, keeping upfront costs down for customers.

“Home WiFi is the way customers most commonly experience our internet service, so it must be the best it can be,” said Heather McCallion, Vice President of Products and Programming for Atlantic Broadband. “As in-home WiFi becomes increasingly important to our customers, their in-home networks must be reliable, fast and deliver the connectivity they need to work and learn from home. Now, through our partnership with Plume, Atlantic Broadband’s high-capacity, fiber-rich network will be joined with a powerful in-home network to deliver a phenomenal WiFi experience with wall-to-wall coverage, personalized controls and superfast speeds up to 1 Gig.”

“Plume is thrilled to enable Atlantic Broadband to deliver an unparalleled in home experience by providing access to an expanded and highly personalized managed WiFi experience featuring high-speed connectivity, parental controls and guest access, tightly secured devices and more,” said Tyson Marian, Chief Commercial Officer at Plume. “Now more than ever subscribers need access to an expanded set of in-home experiences to enrich their daily lives––by rolling out WiFi Your Way powered by Plume HomePass, Atlantic Broadband has introduced a powerful solution to meet the needs of the ever-changing smart home.”

To learn more about the WiFi Your Way solution powered by Plume HomePass, visit https://atlanticbb.com/support/wifiyourway. To learn about Atlantic Broadband’s Internet, phone and TV offerings for business, visit atlanticbb.com/business.

ABOUT ATLANTIC BROADBAND

Atlantic Broadband, a subsidiary of Cogeco Communications Inc. (TSX: CCA), is the eighth largest cable operator in the United States, based on the number of television service customers served. The company provides its residential and business customers with Internet, TV and Phone services in 11 states: Connecticut, Delaware, Florida, Maine, Maryland, New Hampshire, New York, Pennsylvania, South Carolina, Virginia and West Virginia. Atlantic Broadband is headquartered in Quincy, Massachusetts. WiFi Your Way is a registered trademark of Atlantic Broadband.

ABOUT PLUME®

Plume is the creator of the world’s first Consumer Experience Management (CEM) Platform, powered by OpenSync™, which enables the curation and delivery of new Smart Home Services rapidly and at massive scale. The Plume HomePass™ Smart Home Services Suite which includes Plume Adapt™, Guard™, Control™, and Sense™ is managed by the Plume Cloud, a data- and AI-driven cloud controller currently running the largest software-defined network in the world. Plume leverages OpenSync, an open-source framework which comes pre-integrated and supported on the leading silicon and platform SDKs for coordination by the Plume Cloud. Visit www.plume.com and www.opensync.io.

Plume, Powered by Plume HomePass, OpenSync, HomePass, Haystack, SuperPod, Adapt, Guard, Control, and Sense are either trademarks or registered trademarks of Plume Design, Inc. Other company and product names are used for informational purposes only and may be trademarks of their respective owners.

Media

Andrew Walton

Atlantic Broadband

617.786.8800 x102

[email protected]

[email protected]

Andrew Laszacs

Bob Gold & Associates for Plume

+1 310.940.4458

[email protected]

KEYWORDS: Massachusetts United States North America

INDUSTRY KEYWORDS: VoIP Software Mobile/Wireless Networks Internet Data Management Technology Semiconductor Security Satellite Audio/Video Telecommunications

MEDIA:

Logo
Logo

Caldwell Securities Ltd. Is Celebrating 40 Years – Est. 1981

TORONTO, Jan. 11, 2021 (GLOBE NEWSWIRE) — Caldwell Securities Ltd. (“CSL”) is turning 40 years old tomorrow! – January 12th, 2021.

As with most entrepreneurial organizations, CSL started with a vision. Our Founder and Chairman, Thomas S. Caldwell, C.M., worked in the 1960’s and early 1970’s in trading and institutional sales with the world’s largest investment firm.

His vision was to create a firm where people could discuss not only their securities, but also their aspirations and concerns with an Advisor who genuinely cared and understood their needs.

We will be celebrating this milestone with a virtual cooking event featuring our Chairman and Chef Kyle McClure from Vantage Venues on Tuesday, January 12 at 6pm (EST). We hope you can join us.

To register for our virtual cooking event, go to www.caldwellsecurities.com

For more information, or to speak with Thomas S. Caldwell, C.M., contact:
Elizabeth Naumovski
Vice President, Marketing
[email protected]


Fluor Awarded Reimbursable Services Contract for North America’s First Small Modular Nuclear Reactor Project by Utah Associated Municipal Power Systems (UAMPS)

Fluor Awarded Reimbursable Services Contract for North America’s First Small Modular Nuclear Reactor Project by Utah Associated Municipal Power Systems (UAMPS)

Fluor’s NuScale Power also signs development cost reimbursement agreement with UAMPS

IRVING, Texas–(BUSINESS WIRE)–Fluor Corporation (NYSE: FLR) announced today that Utah Associated Municipal Power Systems (UAMPS) awarded the company a cost-reimbursable development agreement to provide estimating, development, design and engineering services for its Carbon-Free Power Project. Fluor will book the initial undisclosed value in the first quarter of 2021 and as it accrues.

This press release features multimedia. View the full release here: https://www.businesswire.com/news/home/20210111006008/en/

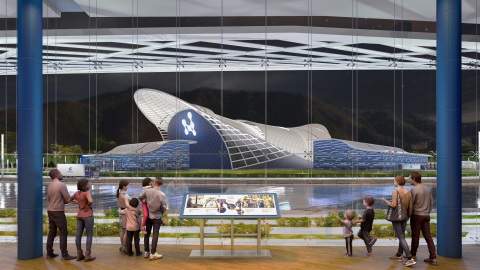
A futuristic rendering of the NuScale Power plant (Photo: Business Wire)

A futuristic rendering of the NuScale Power plant (Photo: Business Wire)

“Fluor’s development agreement with UAMPS for its Carbon-Free Power Project is a monumental milestone toward providing clean load following, base load energy for UAMPS members using NuScale Power’s unique small modular reactor design,” said Alan Boeckmann, executive chairman of Fluor. “Fluor has been a preeminent player in the nuclear industry for 70 years and is well positioned to assist UAMPS and the DOE to accomplish their objectives to provide carbon-free energy for its customers and to deploy a commercially viable small modular reactor with safety, security and performance characteristics that exceed the operational capabilities of current certified designs.”

The U.S. Department of Energy (DOE) recently provided UAMPS a multi-year cost-share award for up to $1.355 billion in funding, subject to future year appropriations, to aid in the development of the first small modular nuclear reactor project in the U.S. The DOE funding is intended to mitigate licensing and financial risk and to accelerate commercial deployment schedules in order to meet critical U.S. energy, environment and economic goals.

Fluor has been serving the nuclear industry for more than 70 years including the design and construction support for more than 25 nuclear plants, plus nearly 100 million hours of nuclear operations and maintenance work. Fluor also provides the following nuclear industry services: decontamination and decommissioning, emergency response and recovery, environmental remediation, laboratory management, national security, nuclear power plant support services, site closure management and waste management.

About Fluor Corporation

Fluor Corporation (NYSE: FLR) is a global engineering, procurement, fabrication, construction and maintenance company with projects and offices on six continents. Fluor’s 45,000 employees build a better world and provide sustainable solutions by designing, building and maintaining safe, well executed projects. Fluor had revenue of $17.3 billion in 2019 and is ranked 181 among the Fortune 500 companies. With headquarters in Irving, Texas, Fluor has served its clients for more than 100 years. For more information, please visit www.fluor.com or follow Fluor on Twitter, LinkedIn, Facebook and YouTube.

#corp

Brian Mershon

Global Media Relations

864.281.6484

Jason Landkamer

Investor Relations

469.398.7222

KEYWORDS: Utah Texas United States North America

INDUSTRY KEYWORDS: Engineering Manufacturing Commercial Building & Real Estate Energy Construction & Property Building Systems Nuclear

MEDIA:

Logo
Logo
Photo
Photo
A futuristic rendering of the NuScale Power plant (Photo: Business Wire)

SWI SECURITIES FRAUD LAWSUIT FILED: Hagens Berman Encourages SolarWinds (SWI) Investors with Losses to Contact Firm Now

SAN FRANCISCO, Jan. 11, 2021 (GLOBE NEWSWIRE) — Hagens Berman urges SolarWinds Corporation (NYSE: SWI) investors with significant losses to submit your losses now. A securities fraud class action has been filed and certain investors may have valuable claims.

Class Period: Feb. 24, 2020 – Dec. 15, 2020
Lead Plaintiff Deadline: March 5, 2021
Visit:www.hbsslaw.com/investor-fraud/SWI
Contact An Attorney Now:[email protected]
                                          844-916-0895

SolarWinds Corporation (SWI) Securities Fraud Class Action:

The complaint alleges that throughout the Class Period, Defendants misrepresented and concealed that: (1) since mid-2020, SolarWinds’ Orion monitoring products had a vulnerability that allowed hackers to compromise the server upon which the products ran; (2) SolarWinds’ update server had an easily accessible password; and (3) consequently, SolarWinds’ customers, including the Federal Government, Microsoft, Cisco, and Nvidia, were vulnerable to hacks.

Investors allegedly began to learn the truth on Dec. 13, 2020 when Reuters reported Russian hackers had infiltrated the U.S. Treasury and Commerce departments’ systems by tampering with SolarWinds updates.

Then, on Dec. 14, 2020 SolarWinds confirmed the vulnerability was inserted in its Orion monitoring products and existed in updates released between March and June 2020.

On Dec. 15, 2020, Reuters reported that (1) a security researcher alerted SolarWinds last year that anyone could access the company’s update server by using the password “solarwinds123,” and (2) a cyber security expert noticed that even days after SolarWinds knew their software was compromised the malicious updates were still available for download.

Significantly, shortly before these events unfolded and caused SolarWinds shares to crater, two investors controlling a majority of SolarWinds’ board of directors sold $285 million of SolarWinds shares.

“We’re focused on proving that SolarWinds knew about the security vulnerabilities before disclosing them,” said Reed Kathrein, the Hagens Berman partner leading the investigation.

If you are a SolarWinds investor and have significant losses, or have knowledge that may assist the firm’s investigation, click here to discuss your legal rights with Hagens Berman.

Whistleblowers: Persons with non-public information regarding SolarWinds Corporation should consider their options to help in the investigation or take advantage of the SEC Whistleblower program. Under the new program, whistleblowers who provide original information may receive rewards totaling up to 30 percent of any successful recovery made by the SEC. For more information, call Reed Kathrein at 844-916-0895 or email [email protected].


About Hagens Berman


Hagens Berman is a national law firm with nine offices in eight cities around the country and eighty attorneys. The firm represents investors, whistleblowers, workers and consumers in complex litigation. More about the firm and its successes is located at hbsslaw.com. For the latest news visit our newsroom or follow us on Twitter at @classactionlaw.

Contact:

Reed Kathrein, 844-916-0895


Acorda Therapeutics to Present at H.C. Wainwright BIOCONNECT Virtual Conference

Acorda Therapeutics to Present at H.C. Wainwright BIOCONNECT Virtual Conference

ARDSLEY, N.Y.–(BUSINESS WIRE)–
Acorda Therapeutics, Inc. (NASDAQ: ACOR) announced that Ron Cohen, M.D., President and Chief Executive Officer, will present during the January 11th -14th H.C. Wainwright BIOCONNECT Virtual Conference. An audio webcast of the presentation can be accessed under “Investor Events” in the Investor section of the Acorda website at www.acorda.com.

For more information about the conference, please visit the event website at www.hcwevents.com/bioconnect.

About Acorda Therapeutics

Acorda Therapeutics develops therapies to restore function and improve the lives of people with neurological disorders. INBRIJA® (levodopa inhalation powder) is approved for intermittent treatment of OFF episodes in adults with Parkinson’s disease treated with carbidopa/levodopa. INBRIJA is not to be used by patients who take or have taken a nonselective monoamine oxidase inhibitor such as phenelzine or tranylcypromine within the last two weeks. INBRIJA utilizes Acorda’s innovative ARCUS® pulmonary delivery system, a technology platform designed to deliver medication through inhalation. Acorda also markets the branded AMPYRA® (dalfampridine) Extended Release Tablets, 10 mg.

Forward-Looking Statements

This press release includes forward-looking statements. All statements, other than statements of historical facts, regarding management’s expectations, beliefs, goals, plans or prospects should be considered forward-looking. These statements are subject to risks and uncertainties that could cause actual results to differ materially, including: we may not be able to successfully market INBRIJA or any other products under development; the COVID-19 pandemic, including related quarantines and travel restrictions, and the potential for the illness to affect our employees or consultants or those that work for other companies we rely upon, could have a material adverse effect on our business operations or product sales; our ability to raise additional funds to finance our operations, repay outstanding indebtedness or satisfy other obligations, and our ability to control our costs or reduce planned expenditures and take other actions which are necessary for us to continue as a going concern; risks associated with the trading of our common stock and our reverse stock split; risks associated with complex, regulated manufacturing processes for pharmaceuticals, which could affect whether we have sufficient commercial supply of INBRIJA to meet market demand; third party payers (including governmental agencies) may not reimburse for the use of INBRIJA or our other products at acceptable rates or at all and may impose restrictive prior authorization requirements that limit or block prescriptions; competition for INBRIJA, AMPYRA and other products we may develop and market in the future, including increasing competition and accompanying loss of revenues in the U.S. from generic versions of AMPYRA (dalfampridine) following our loss of patent exclusivity; the ability to realize the benefits anticipated from acquisitions, among other reasons because acquired development programs are generally subject to all the risks inherent in the drug development process and our knowledge of the risks specifically relevant to acquired programs generally improves over time; the risk of unfavorable results from future studies of INBRIJA (levodopa inhalation powder) or from our other research and development programs, or any other acquired or in-licensed programs ; the occurrence of adverse safety events with our products; the outcome (by judgment or settlement) and costs of legal, administrative or regulatory proceedings, investigations or inspections, including, without limitation, collective, representative or class action litigation; failure to protect our intellectual property, to defend against the intellectual property claims of others or to obtain third party intellectual property licenses needed for the commercialization of our products; and failure to comply with regulatory requirements could result in adverse action by regulatory agencies. These and other risks are described in greater detail in our filings with the Securities and Exchange Commission. We may not actually achieve the goals or plans described in our forward-looking statements, and investors should not place undue reliance on these statements. Forward-looking statements made in this press release are made only as of the date hereof, and we disclaim any intent or obligation to update any forward-looking statements as a result of developments occurring after the date of this press release.

Tierney Saccavino

(917) 783-0251

[email protected]

KEYWORDS: New York United States North America

INDUSTRY KEYWORDS: Biotechnology General Health Pharmaceutical Health

MEDIA:

Logo
Logo

HAGENS BERMAN Alerts Kandi Technologies Group (KNDI) Investors to Application Deadline in Securities Fraud Action, Encourages Investors with Losses to Contact the Firm

SAN FRANCISCO, Jan. 11, 2021 (GLOBE NEWSWIRE) — Hagens Berman urges Kandi Technologies Group, Inc. (NASDAQ: KNDI) investors to submit their losses now. A securities fraud class action has been filed and certain investors may have valuable claims.

Class Period: Mar. 15, 2019 – Nov. 27, 2020
Lead Plaintiff Deadline: Feb. 9, 2021
Visit:www.hbsslaw.com/investor-fraud/KNDI
Contact An Attorney Now:[email protected]
844-916-0895

Kandi Technologies Group, Inc. (KNDI) Securities Fraud Class Action:

The complaint centers on whether Kandi manipulated its financial statements, including overstating revenues.

More specifically, according to the complaint (1) Kandi artificially inflated reported revenues through undisclosed related party transactions, and (2) most of Kandi’s sales during the past year were to undisclosed related parties, indicating the lack of arms-length transactions.

But investors began to learn the truth, according to the complaint, on Nov. 30, 2020, when Hindenburg Research published a scathing lengthy forensic report based on on-the-ground inspections at Kandi’s factories and customer locations in China, interviews with over a dozen former employees, and review of numerous litigation documents and internal public records.

According to Hindenburg, Kandi engaged in a “brazen scheme” to “falsify revenue using fake sales to undisclosed affiliates.” Hindenburg reported (1) it unmasked Kandi’s top customers and found that almost 64% of Kandi’s last twelve months sales have been to undisclosed related parties, and (2) the company’s largest customer, representing about 55% of Kandi’s last twelve months sales, shares a phone number with a Kandi subsidiary and a Kandi executive. Hindenburg further concludes Kandi’s financials corroborate its concerns, noting that “[t]he company has consistently booked revenue it cannot collect, a classic hallmark of fake revenue.”

This news drove the price of Kandi shares crashing lower.

“We’re focused on, among other things, investor losses and proving Kandi engaged in revenue recognition fraud,” said Reed Kathrein, the Hagens Berman partner leading the investigation.

If you are a Kandi investor, click here to discuss your legal rights with Hagens Berman.

Whistleblowers: Persons with non-public information regarding Kandi should consider their options to help in the investigation or take advantage of the SEC Whistleblower program. Under the new program, whistleblowers who provide original information may receive rewards totaling up to 30 percent of any successful recovery made by the SEC. For more information, call Reed Kathrein at 844-916-0895 or email [email protected].


About Hagens Berman


Hagens Berman is a national law firm with nine offices in eight cities around the country and eighty attorneys. The firm represents investors, whistleblowers, workers and consumers in complex litigation. More about the firm and its successes is located at hbsslaw.com. For the latest news visit our newsroom or follow us on Twitter at @classactionlaw.

Contact:
Reed Kathrein, 844-916-0895


Concentrix Reports Fiscal 2020 Fourth Quarter and Full Year Results

FREMONT, Calif., Jan. 11, 2021 (GLOBE NEWSWIRE) — Concentrix Corporation (NASDAQ: CNXC), a leading global provider of customer experience (CX) solutions and technology, today announced financial results for the fiscal fourth quarter and fiscal year ended November 30, 2020.

  Three Months Ended    
  November 30, 2020   November 30, 2019   Change
Revenue ($M) $ 1,300.9     $ 1,212.8     7.3 %
Operating income ($M) $ 120.2     $ 101.5     18.4 %
Non-GAAP operating income ($M) (1) $ 175.4     $ 165.0     6.3 %
Operating margin 9.2 %   8.4 %   80 bps
Non-GAAP operating margin (1) 13.5 %   13.6 %   -10 bps
Net income ($M) $ 64.6     $ 31.9     102.5 %
Non-GAAP net income ($M) (1) $ 106.8     $ 80.0     33.5 %
Adjusted EBITDA ($M) (1) $ 211.2     $ 197.7     6.8 %
Adjusted EBITDA margin (1) 16.2 %   16.3 %   -10 bps
Basic and diluted earnings per share (2) $ 1.25     $ 0.62     101.6 %
Non-GAAP basic and diluted earnings per share (2) $ 2.07     $ 1.55     33.5 %


(1) See non-GAAP reconciliations included in the accompanying financial tables for the reconciliation of each non- GAAP measure to its most directly comparable GAAP measure.


(2) Weighted average number of shares used for both basic and diluted EPS is based on the number of common shares issued in connection with the spin-off.

Fourth Quarter Fiscal 2020 Highlights:

  • Revenue was $1,300.9 million, up 7.3% from the prior fiscal year fourth quarter and 6.3% on a constant currency basis, compared with $1,212.8 million in the prior fiscal year fourth quarter.
  • Operating income was $120.2 million, or 9.2% of revenue, compared with $101.5 million, or 8.4% of revenue in the prior fiscal year fourth quarter.
  • Non-GAAP operating income was $175.4 million, or 13.5% of revenue, compared with $165.0 million, or 13.6% of revenue, in the prior fiscal year fourth quarter.
  • Adjusted EBITDA was $211.2 million, or 16.2% of revenue, compared with $197.7 million, or 16.3% of revenue, in the prior fiscal year fourth quarter.

“We are pleased with our execution in the fourth quarter with revenue growth and profitability exceeding expectations,” said Chris Caldwell, Concentrix President and CEO. “During the fourth quarter we were able to capitalize on our robust signings in the third quarter, and we believe we also gained share on in-period volumes. Entering 2021 as an independent industry leader, we see opportunities for additional innovation and our ability to enhance value creation for shareholders.”

Fiscal Year 2020 Summary

  Fiscal Year Ended    
  November 30, 2020   November 30, 2019   Change
Revenue ($M) $ 4,719.5     $ 4,707.9     0.2 %
Operating income ($M) $ 308.8     $ 294.3     4.9 %
Non-GAAP operating income ($M) (1) $ 509.4     $ 542.0     (6.0 )%
Operating margin 6.5 %   6.3 %   20 bps
Non-GAAP operating margin (1) 10.8 %   11.5 %   -70 bps
Net income ($M) $ 164.8     $ 117.2     40.6 %
Non-GAAP net income ($M) (1) $ 316.5     $ 304.7     3.9 %
Adjusted EBITDA ($M) (1) $ 638.5     $ 676.8     (5.7 )%
Adjusted EBITDA margin (1) 13.5 %   14.4 %   -90 bps
Basic and diluted earnings per share (2) $ 3.19     $ 2.27     40.5 %
Non-GAAP basic and diluted earnings per share (2) $ 6.13     $ 5.90     3.9 %


(1) See non-GAAP reconciliations included in the accompanying financial tables for the reconciliation of each non- GAAP measure to its most directly comparable GAAP measure.


(2) Weighted average number of shares used for both basic and diluted EPS is based on the number of common shares issued in connection with the spin-off.

Fiscal Year 2020 Highlights:

  • Revenue was $4,719.5 million, up 0.2% from the prior fiscal year and 0.7% on a constant currency basis, compared with $4,707.9 million in the prior fiscal year.
  • Operating income was $308.8 million, or 6.5% of revenue, compared with $294.3 million, or 6.3% of revenue, in the prior fiscal year.
  • Non-GAAP operating income was $509.4 million, or 10.8% of revenue, compared with $542.0 million, or 11.5% of revenue, in the prior fiscal year.
  • Adjusted EBITDA was $638.5 million, or 13.5% of revenue, compared with $676.8 million, or 14.4% of revenue, in the prior fiscal year.
  • On a net basis, COVID expenses were approximately $86.0 million for fiscal year 2020.

First Quarter Fiscal 2021 Outlook:

The following statements are based on Concentrix’ current expectations for the fiscal 2021 first quarter. Non-GAAP financial measures exclude the impact of acquisition-related and integration expenses, spin-off related expenses, the amortization of intangibles, depreciation, share based compensation and the related tax effects thereon. These statements are forward-looking and actual results may differ materially.

  • Revenue is expected to be in the range of $1.260 billion to $1.310 billion as reported.
  • Operating income is expected to be in the range of $107 million to $121 million and non-GAAP operating income is expected to be in the range of $148 million to $162 million.
  • The effective tax rate is expected to approximate 29%.

Conference Call and Webcast

Concentrix will host a conference call for investors to review its fiscal 2020 fourth quarter results tomorrow morning Tuesday, January 12, 2021 at 9:00 a.m. (ET)/6:00 a.m. (PT)

The live conference call will be webcast in listen-only mode in the Investor Relations section of the Concentrix website under “Events and Presentations” at https://ir.concentrix.com/events-and-presentations. A replay will also be available on the website following the conference call.

About Concentrix

Concentrix Corporation (Nasdaq: CNXC), is a leading technology-enabled global business services company specializing in customer engagement and improving business performance for some of the world’s best brands including over 95 Global Fortune 500 clients and over 90 global disruptor clients. Every day, from more than 40 countries and across 6 continents, our staff delivers next generation customer experience and helps companies better connect with their customers. We create better business outcomes and help differentiate our clients through technology, design, data, process, and people. Concentrix provides services to clients in our key industry verticals: technology & consumer electronics; retail, travel & ecommerce; banking, financial services & insurance; healthcare; communications & media; automotive; and energy & public sector. We are Different by Design. Visit concentrix.com to learn more.

Use of Non-GAAP Information

In addition to disclosing financial results that are determined in accordance with GAAP, we also disclose certain non-GAAP financial information, including:

  • Constant currency revenue growth, which is revenue growth adjusted for the translation effect of foreign currencies so that certain financial results can be viewed without the impact of fluctuations in foreign currency exchange rates, thereby facilitating period-to-period comparisons of our business performance. Constant currency revenue growth is calculated by translating the revenue of each fiscal year in the billing currency using their comparable prior year’s currency conversion rate in comparison to prior year’s revenue. Generally, when the dollar either strengthens or weakens against other currencies, the growth at constant currency rates or adjusting for currency will be higher or lower than growth reported at actual exchange rates.
  • Non-GAAP operating income, which is operating income, adjusted to exclude acquisition-related and integration expenses, including related restructuring costs, spin-off related expenses, amortization of intangible assets and share-based compensation.
  • Non-GAAP operating margin, which is non-GAAP operating income, as defined above, divided by revenue.
  • Adjusted earnings before interest, taxes, depreciation, and amortization, or adjusted EBITDA, which is non-GAAP operating income, as defined above, plus depreciation.
  • Adjusted EBITDA margin, which is adjusted EBITDA, as defined above, divided by revenue.
  • Free cash flow, which is cash flows from operating activities less capital expenditures. We believe that free cash flow is a meaningful measure of cash flows since capital expenditures are a necessary component of ongoing operations. However, free cash flow has limitations because it does not represent the residual cash flow available for discretionary expenditures. For example, free cash flow does not incorporate payments for business acquisitions.

We believe that providing this additional information is useful to the reader to better assess and understand our base operating performance, especially when comparing results with previous periods and for planning and forecasting in future periods, primarily because management typically monitors the business adjusted for these items in addition to GAAP results. Management also uses these non-GAAP measures to establish operational goals and, in some cases, for measuring performance for compensation purposes. These non-GAAP financial measures exclude amortization of intangible assets. Although intangible assets contribute to our revenue generation, the amortization of intangible assets does not directly relate to the services performed for our clients. Additionally, intangible asset amortization expense typically fluctuates based on the size and timing of our acquisition activity. Accordingly, we believe excluding the amortization of intangible assets, along with the other non-GAAP adjustments which neither relate to the ordinary course of our business nor reflect our underlying business performance, enhances our and our investors’ ability to compare our past financial performance with its current performance and to analyze underlying business performance and trends. These non-GAAP financial measures also exclude share-based compensation expense. Given the subjective assumptions and the variety of award types that companies can use when calculating share-based compensation expense, management believes this additional information allows investors to make additional comparisons between our operating results and those of our peers. As these non-GAAP financial measures are not calculated in accordance with GAAP, they may not necessarily be comparable to similarly titled measures employed by other companies. These non-GAAP financial measures should not be considered in isolation or as a substitute for the comparable GAAP measures and should be used as a complement to, and in conjunction with, data presented in accordance with GAAP.

Safe Harbor Statement
This news release includes forward-looking statements within the meaning of Section 27A of the Securities Act of 1933 and Section 21E of the Securities Exchange Act of 1934. Forward-looking statements include, but are not limited to, statements regarding the Company’s expected future financial condition, results of operations, including revenue and operating income, effective tax rate, cash flows, leverage, liquidity, business strategy, competitive position, acquisition opportunities, capital allocation, growth opportunities, market forecasts and statements that include words such as believe, expect, may, will, provide, could and should and other similar expressions. These forward-looking statements are inherently uncertain and involve substantial risks and uncertainties that could cause actual results to differ materially from those expressed or implied by such statements. Risks and uncertainties include, among other things: risks related to general economic conditions, including uncertainty related to the COVID-19 pandemic and its impact on the global economy; the level of outsourced business services; the level of business activity of the Company’s clients and the market acceptance and performance of their products and services; consolidation of the Company’s competitors; competitive conditions in the Company’s industry; currency exchange rate fluctuations; variability in demand by the Company’s clients or the early termination of the Company’s client contracts; competition in the customer experience solutions industry; political and economic stability in the countries in which the Company operates; the outbreak of communicable disease or other public health crises; cyberattacks on the Company’s networks and information technology systems; the inability to protect personal and proprietary information; increases in the cost of labor; the operability of the Company’s communication services and information technology systems and networks; changes in law, regulations or regulatory guidance; investigative or legal actions; the loss of key personnel; natural disasters, adverse weather conditions, terrorist attacks, work stoppages or other business disruptions; and other factors contained in the Company’s Registration Statement on Form 10 filed with the Securities and Exchange Commission and subsequent SEC filings. The Company does not undertake a duty to update forward-looking statements, which speak only as of the date on which they are made.

Copyright 2021 Concentrix Corporation. All rights reserved. Concentrix, the Concentrix logo, and all other Concentrix company, product and services names and slogans are trademarks or registered trademarks of Concentrix Corporation. Concentrix and the Concentrix logo Reg. U.S. Pat. & Tm. Off. Other names and marks are the property of their respective owners.

CONCENTRIX

(CUSTOMER EXPERIENCE SERVICES BUSINESS OF SYNNEX CORPORATION)

COMBINED STATEMENTS OF OPERATIONS (unaudited)

(currency and share amounts in thousands, except per share amounts)
(Amounts may not add due to rounding)

 
  Three Months Ended       Fiscal Year Ended    
  November 30, 2020   November 30, 2019   % Change   November 30, 2020   November 30, 2019   % Change
Revenue                      
Technology and consumer electronics $ 410,542     $ 343,700     19 %   $ 1,422,817     $ 1,283,084     11 %
Communications and media 239,268     273,108     (12 )%   954,234     1,142,242     (16 )%
Retail, travel and ecommerce 237,912     198,749     20 %   796,324     763,265     4 %
Banking, financial services and insurance 185,522     177,362     5 %   712,469     676,246     5 %
Healthcare 118,558     101,159     17 %   392,686     369,187     6 %
Other 109,056     118,758     (8 )%   441,004     473,888     (7 )%
Total revenue 1,300,858     1,212,836     7 %   4,719,534     4,707,912     — %
Cost of revenue 842,226     754,405     12 %   3,058,009     2,959,464     3 %
Gross profit 458,632     458,431     — %   1,661,525     1,748,448     (5 )%
Selling, general and administrative expenses (338,425 )   (356,977 )   (5 )%   (1,352,764 )   (1,454,116 )   (7 )%
Operating income 120,207     101,454     18 %   308,761     294,332     5 %
Interest expense (primarily related to borrowings from Parent) and finance charges, net (8,798 )   (20,226 )   (57 )%   (48,313 )   (92,196 )   (48 )%
Other income (expense), net 3,164     (401 )   (889 )%   7,447     2,280     227 %
Income before income taxes 114,573     80,827     42 %   267,895     204,416     31 %
Provision for income taxes (49,946 )   (48,957 )   2 %   (103,084 )   (87,252 )   18 %
Net income $ 64,627     $ 31,870     103 %   $ 164,811     $ 117,164     41 %
Earnings per common share:                      
Basic $ 1.25     $ 0.62         $ 3.19     $ 2.27      
Diluted $ 1.25     $ 0.62         $ 3.19     $ 2.27      
Weighted-average common shares outstanding                      
Basic 51,602     51,602         51,602     51,602      
Diluted 51,602     51,602         51,602     51,602      
 

CONCENTRIX

(CUSTOMER EXPERIENCE SERVICES BUSINESS OF SYNNEX CORPORATION)

COMBINED BALANCE SHEETS (unaudited)

(currency in thousands)
(Amounts may not add due to rounding)

 
  November 30, 2020   November 30, 2019
ASSETS      
Current assets:      
Cash and cash equivalents $ 152,656     $ 79,656  
Accounts receivable, net 1,079,065     931,082  
Receivable from SYNNEX Corporation (“Parent”) 2,416     17,495  
Loan receivable from Parent —     67,676  
Other current assets 189,239     203,696  
Total current assets 1,423,376     1,299,605  
Property and equipment, net 451,649     411,465  
Goodwill 1,836,050     1,829,328  
Intangible assets, net 798,959     934,123  
Deferred tax assets 47,423     64,879  
Other assets 620,099     114,355  
Total assets $ 5,177,556     $ 4,653,755  
       
LIABILITIES AND EQUITY      
Current liabilities:      
Accounts payable $ 140,575     $ 106,147  
Current portion of long-term debt 33,750     —  
Payable to Parent 22,825     85,898  
Loans payable to Parent —     1,981,385  
Accrued compensation and benefits 419,715     319,065  
Other accrued liabilities 371,072     189,605  
Income taxes payable 20,725     16,209  
Total current liabilities 1,008,662     2,698,308  
Long-term debt 1,111,362     —  
Other long-term liabilities 601,887     297,034  
Deferred tax liabilities 153,560     188,572  
Total liabilities 2,875,471     3,183,914  
Equity:      
Parent company investment 2,305,899     1,519,923  
Accumulated other comprehensive income (loss) (3,814 )   (50,082 )
Total Parent equity 2,302,085     1,469,841  
Total liabilities and equity $ 5,177,556     $ 4,653,755  
 

CONCENTRIX

(CUSTOMER EXPERIENCE SERVICES BUSINESS OF SYNNEX CORPORATION)

RECONCILIATION OF GAAP TO NON-GAAP MEASURES (unaudited)

(currency in thousands)
(Amounts may not add due to rounding)

 
  Three Months Ended


  Fiscal Year Ended
  November 30, 2020   November 30, 2019


  November 30, 2020   November 30, 2019
Revenue $ 1,300,858     $ 1,212,836     $ 4,719,534     $ 4,707,912  
Revenue growth, as reported under U.S. GAAP 7.3 %   24.7 %   0.2 %   91.1 %
Foreign exchange impact (1.0 )%   1.1 %   0.5 %   2.2 %
Constant currency revenue growth 6.3 %   25.8 %   0.7 %   93.3 %

  Three Months Ended


  Fiscal Year Ended
  November 30, 2020   November 30, 2019


  November 30, 2020   November 30, 2019
Operating income $ 120,207     $ 101,454     $ 308,761     $ 294,332  
Acquisition-related and integration expenses 6,552     18,042     27,982     70,473  
Spin-off related expenses 7,694     —     9,483     —  
Amortization of intangibles 37,093     41,425     147,283     166,606  
Share-based compensation 3,883     4,074     15,914     10,554  
Non-GAAP operating income $ 175,429     $ 164,995     $ 509,423     $ 541,965  
 

CONCENTRIX

(CUSTOMER EXPERIENCE SERVICES BUSINESS OF SYNNEX CORPORATION)

RECONCILIATION OF GAAP TO NON-GAAP MEASURES

(unaudited)

(currency in thousands)
(Amounts may not add due to rounding)

 
  Three Months Ended   Fiscal Year Ended
  November 30, 2020   November 30, 2019   November 30, 2020   November 30, 2019
Net income $ 64,627     $ 31,870     $ 164,811     $ 117,164  
Interest expense and finance charges, net 8,798     20,226     48,313     92,196  
Provision for income taxes 49,946     48,957     103,084     87,252  
Other (income) expense, net (3,164 )   401     (7,447 )   (2,280 )
Acquisition-related and integration expenses 6,552     18,042     27,982     70,473  
Spin-off related expenses 7,694     —     9,483     —  
Amortization of intangibles 37,093     41,425     147,283     166,606  
Share-based compensation 3,883     4,074     15,914     10,554  
Depreciation (excluding accelerated depreciation included in acquisition-related and integration expenses above) 35,795     32,697     129,126     134,823  
Adjusted EBITDA $ 211,224     $ 197,692     $ 638,549     $ 676,788  

  Three Months Ended   Fiscal Year Ended
  November 30, 2020   November 30, 2019   November 30, 2020   November 30, 2019
Operating margin 9.2 %   8.4 %   6.5 %   6.3 %
Non-GAAP operating margin 13.5 %   13.6 %   10.8 %   11.5 %
Adjusted EBITDA margin 16.2 %   16.3 %   13.5 %   14.4 %
                       

CONCENTRIX

(CUSTOMER EXPERIENCE SERVICES BUSINESS OF SYNNEX CORPORATION)

RECONCILIATION OF GAAP TO NON-GAAP MEASURES (unaudited)

(currency in thousands)
(Amounts may not add due to rounding)

     
  Three Months Ended


  Fiscal Year Ended
  November 30, 2020   November 30, 2019


  November 30, 2020   November 30, 2019
Net income $ 64,627     $ 31,870     $ 164,811     $ 117,164  
Acquisition-related and integration expenses 6,552     18,042     27,982     70,473  
Spin-off related expenses 7,694     —     9,483     —  
Amortization of intangibles 37,093     41,425     147,283     166,606  
Share-based compensation 3,883     4,074     15,914     10,554  
Income taxes related to the above (1) (13,037 )   (15,453 )   (49,010 )   (60,118 )
Non-GAAP net income $ 106,812     $ 79,958     $ 316,463     $ 304,679  
               

CONCENTRIX

(CUSTOMER EXPERIENCE SERVICES BUSINESS OF SYNNEX CORPORATION)

RECONCILIATION OF GAAP TO NON-GAAP MEASURES (unaudited)

(currency in thousands, except per share amounts)
(Amounts may not add due to rounding)

     
  Three Months Ended


  Fiscal Year Ended
  November 30, 2020   November 30, 2019


  November 30, 2020   November 30, 2019
Basic and diluted earnings per common share (“EPS”) (2) $ 1.25     $ 0.62     $ 3.19     $ 2.27  
Acquisition-related and integration expenses $ 0.13     $ 0.35     $ 0.54     $ 1.37  
Spin-off related expenses $ 0.15     $ —     $ 0.18     $ —  
Amortization of intangibles $ 0.72     $ 0.80     $ 2.85     $ 3.23  
Share-based compensation $ 0.08     $ 0.08     $ 0.31     $ 0.20  
Income taxes related to the above (1) $ (0.26 )   $ (0.30 )   $ (0.94 )   $ (1.17 )
Non-GAAP basic and diluted EPS (2) $ 2.07     $ 1.55     $ 6.13     $ 5.90  

  Three Months Ended   Fiscal Year Ended
  November 30, 2020   November 30, 2019   November 30, 2020   November 30, 2019
Net cash provided by operating activities $ 119,037     $ 166,848     $ 507,614     $ 449,736  
Purchases of property and equipment (65,083 )   (40,148 )   (171,332 )   (111,122 )
Free cash flow $ 53,954     $ 126,700     $ 336,282     $ 338,614  
                

CONCENTRIX

(CUSTOMER EXPERIENCE SERVICES BUSINESS OF SYNNEX CORPORATION)

RECONCILIATION OF GAAP TO NON-GAAP MEASURES (unaudited)

(currency in thousands)
(Amounts may not add due to rounding)

 
  Forecast
  Three Months Ended February 28, 2021
  Low   High
Operating income $ 107,000     $ 121,000  
Amortization of intangibles 34,000     34,000  
Share-based compensation 7,000     7,000  
Non-GAAP operating income (3) $ 148,000     $ 162,000  


(1) The tax effect of taxable and deductible non-GAAP adjustments was calculated using the tax-deductible portion of the expenses and applying the entity-specific, statutory tax rates applicable to each item during the respective fiscal years.


(2) Weighted average number of shares used for both basic and diluted EPS is based on number of common shares issued and outstanding in connection with the spin-off of 51.6 million for all periods presented.


(3) Adjustments related to acquisition-related and integration expenses and spin-off related expenses are not expected to be material for the three months ended February 28, 2021.


Investor Contact:
David Stein
Investor Relations
Concentrix Corporation
[email protected]
(513) 703-9306

BlackRock TCP Capital Corp. Schedules Earnings Release and Conference Call for the Fourth Quarter and Fiscal Year Ended December 31, 2020

BlackRock TCP Capital Corp. Schedules Earnings Release and Conference Call for the Fourth Quarter and Fiscal Year Ended December 31, 2020

SANTA MONICA, Calif.–(BUSINESS WIRE)–
BlackRock TCP Capital Corp. (NASDAQ: TCPC) announced today that it will report its financial results for the fourth quarter and fiscal year ended December 31, 2020 on Thursday, February 25, 2021, prior to the opening of the financial markets.

BlackRock TCP Capital Corp. will host a conference call at 1:00 p.m. Eastern Time (10:00 a.m. Pacific Time) on Thursday, February 25, 2021 to discuss its financial results.

All interested parties are invited to participate in the conference call by dialing (866) 393-0571; international callers should dial (206) 453-2872. Participants should enter the Conference ID 9091365 when prompted. The conference call will be webcast simultaneously in the investor relations section of TCPC’s website at http://investors.tcpcapital.com. An archived replay of the call will be available approximately two hours after the live call, through March 4, 2021. For the replay, please visit https://investors.tcpcapital.com/events-and-presentations or dial (855) 859-2056. For international replay, please dial (404) 537-3406. For all replays, please reference program ID number 9091365.

ABOUT BLACKROCK TCP CAPITAL CORP.:

BlackRock TCP Capital Corp. (NASDAQ: TCPC) is a specialty finance company focused on direct lending to middle-market companies as well as small businesses. TCPC lends primarily to companies with established market positions, strong regional or national operations, differentiated products and services and sustainable competitive advantages, investing across industries in which it has significant knowledge and expertise. TCPC’s investment objective is to achieve high total returns through current income and capital appreciation, with an emphasis on principal protection. TCPC is a publicly traded business development company, or BDC, regulated under the Investment Company Act of 1940 and is externally managed by its advisor, Tennenbaum Capital Partners, LLC, a wholly-owned, indirect subsidiary of BlackRock, Inc. For more information, visit www.tcpcapital.com.

FORWARD-LOOKING STATEMENTS

Prospective investors considering an investment in BlackRock TCP Capital Corp. should consider the investment objectives, risks and expenses of the Company carefully before investing. This information and other information about the Company are available in the Company’s filings with the Securities and Exchange Commission (“SEC”). Copies are available on the SEC’s website at www.sec.gov and the Company’s website at www.tcpcapital.com. Prospective investors should read these materials carefully before investing.

This press release may contain forward-looking statements within the meaning of the Private Securities Litigation Reform Act of 1995. Forward-looking statements are based on estimates, projections, beliefs and assumptions of management of the Company at the time of such statements and are not guarantees of future performance. Forward-looking statements involve risks and uncertainties in predicting future results and conditions. Actual results could differ materially from those projected in these forward-looking statements due to a variety of factors, including, without limitation, changes in general economic conditions or changes in the conditions of the industries in which the Company makes investments, risks associated with the availability and terms of financing, changes in interest rates, availability of transactions, and regulatory changes. Certain factors that could cause actual results to differ materially from those contained in the forward-looking statements are included in the “Risks” section of the Company’s prospectus dated August 16, 2019 and its prospectus supplement dated September 25, 2020, the “Risk Factors” section of the Company’s Form 10-K for the year ended December 31, 2019, and the Company’s subsequent periodic filings with the SEC. Copies are available on the SEC’s website at www.sec.gov and the Company’s website at www.tcpcapital.com. Forward-looking statements are made as of the date of this press release and are subject to change without notice. The company has no duty and does not undertake any obligation to update or revise any forward-looking statements based on the occurrence of future events, the receipt of new information, or otherwise.

BlackRock TCP Capital Corp.

Katie McGlynn

310-566-1094

[email protected]

KEYWORDS: California United States North America

INDUSTRY KEYWORDS: Finance Consulting Banking Accounting Professional Services

MEDIA:

Logo
Logo

The China Fund, Inc. Announces Date of Annual Meeting of Stockholders

PR Newswire

BOSTON, Jan. 11, 2021 /PRNewswire/ — The China Fund, Inc. (NYSE: CHN) (the “Fund”) announced today that the Fund’s annual stockholder meeting (the “Meeting”) will be held Tuesday, March 9, 2021 via a virtual forum at 11:15 a.m. Stockholders of record as of January 11, 2021 will be entitled to notice of, and to attend and vote at, the Meeting. Matthews Asia, International Capital Management, LLC, the investment manager, will be in attendance at the meeting and will provide an update on the China market.

The Fund is a closed-end management investment company with the objective of seeking long-term capital appreciation by investing primarily in equity securities (i) of companies for which the principal securities trading market is the People’s Republic of China (“China“), or (ii) of companies for which the principal securities trading market is outside of China, or constituting direct equity investments in companies organized outside of China, that in both cases derive at least 50% of their revenues from goods and services sold or produced, or have at least 50% of their assets, in China. Shares of the Fund are listed on the New York Stock Exchange under the ticker symbol “CHN.”

For further information regarding the Fund and the Fund’s holdings, please call (888)-CHN-CALL or visit the Fund’s website at www.chinafundinc.com.

Cision View original content:http://www.prnewswire.com/news-releases/the-china-fund-inc-announces-date-of-annual-meeting-of-stockholders-301205649.html

SOURCE The China Fund, Inc.