Canopy Growth and TerrAscend’s Arise Bioscience Enter Debt Financing Agreement

PR Newswire

Canopy Growth completes US$20 million loan to Arise Bioscience Inc.

SMITHS FALLS and TORONTO, ON, Dec. 10, 2020 /PRNewswire/ – Canopy Growth Corporation (“Canopy Growth” or the “Company”) (TSX: WEED) (NASDAQ: CGC) and Arise Bioscience Inc. (“Arise”), a wholly owned subsidiary of TerrAscend Corp. (“TerrAscend”) (CSE: TER) (OTCQX: TRSSF) engaged only in the legal sale of CBD products, today announced they have entered into a loan financing arrangement in the amount of US$20 million (the “Loan”) pursuant to a secured debenture (the “Debenture”). In connection with the Loan, TerrAscend has issued 2,105,718 common share purchase warrants to the Company (the “Warrants”).
Canopy Growth initially co-invested in TerrAscend in November 2017. On November 30, 2018, Canopy Growth announced the completion of a restructuring transaction with TerrAscend pursuant to which TerrAscend restructured its share capital by way of a plan of arrangement under the Business Corporations Act (Ontario). Subsequently, in March 2020, Canopy Growth loaned CAD $80.5 million to TerrAscend Canada Inc.

TerrAscend’s management continues to perform very well in high-growth, competitive markets.  With this additional loan into TerrAscend’s Arise business unit, we are confident the team will continue to execute at a high level and that they are well positioned to drive strong value creation for Canopy shareholders,” said David Klein, CEO, Canopy Growth.

Jason Ackerman, Chief Executive Officer and Executive Chairman of TerrAscend, added, “I’d like to thank the Canopy Growth team for their ongoing support and investment as we scale our operations. I’m proud to consider them partners and look forward to continuing to execute on the opportunity ahead.” 

Use of Proceeds

Arise is only engaged in the legal sale of CBD products and does not sell THC products. The Loan proceeds are expected to be used by Arise for general corporate purposes, the repayment of indebtedness and/or for other permitted purposes under the terms of the Debenture. The funds will not be used, directly or indirectly, in connection with or for any cannabis or cannabis-related operations in the United States, unless and until such operations comply with all applicable laws of the United States.

Transaction Overview

The Debenture will bear interest at a rate of 6.10% per annum and will mature on December 9, 2030 or such earlier date in accordance with the terms of the Debenture and all interest payments made pursuant to the Debenture are payable in cash by Arise beginning in the fourth year after issuance of the Debenture. The Debenture is secured by the assets of Arise, is not convertible, and is not guaranteed by TerrAscend. The Warrants are comprised of: (a) 1,926,983 common share purchase warrants (the “First Tranche Warrants”) with each First Tranche Warrant entitling Canopy Growth to acquire one common share of TerrAscend at an exercise price of CAD $15.28 per share; and (b) 178,735 common share purchase warrants (the “Second Tranche Warrants”) with each Second Tranche Warrant entitling Canopy Growth to acquire one common share of TerrAscend at an exercise price of CAD $17.19 per share. The Warrants will be exercisable by Canopy Growth following changes in U.S. federal laws permitting the cultivation, distribution, and possession of marijuana or to remove the regulation of such activities from the federal laws of the United States and the Loan is repayable by Arise at anytime. The First Tranche Warrants expire on December 9, 2030 or such earlier date in accordance with the First Tranche Warrants and the Second Tranche Warrants expire on December 9, 2031 or such earlier date in accordance with the Second Tranche Warrants.

About Canopy Growth

Canopy Growth (TSX:WEED,NASDAQ:CGC ) is a world-leading diversified cannabis and cannabinoid-based consumer product company, driven by a passion to improve lives, end prohibition, and strengthen communities by unleashing the full potential of cannabis. Leveraging consumer insights and innovation, we offer product varieties in high quality dried flower, oil, softgel capsule, infused beverage, edible, and topical formats, as well as vaporizer devices by Canopy Growth and industry-leader Storz & Bickel. Our global medical brand, Spectrum Therapeutics, sells a range of full-spectrum products using its colour-coded classification system and is a market leader in both Canada and Germany. Through our award-winning Tweed and Tokyo Smoke banners, we reach our adult-use consumers and have built a loyal following by focusing on top quality products and meaningful customer relationships. Canopy Growth has entered into the health and wellness consumer space in key markets including Canada, the United States, and Europe through BioSteel sports nutrition, and This Works skin and sleep solutions; and has introduced additional federally-permissible CBD products to the United States through our First & Free and Martha Stewart CBD brands. Canopy Growth has an established partnership with Fortune 500 alcohol leader Constellation Brands. For more information visit www.canopygrowth.com.

About TerrAscend

TerrAscend is a leading North American cannabis operator with vertically integrated operations in Pennsylvania, New Jersey, and California in addition to operating as a licensed producer in Canada. TerrAscend operates an award-winning chain of Apothecarium dispensary retail locations as well as scaled cultivation, processing and manufacturing facilities on both the East and West coasts. TerrAscend’s best-in-class cultivation and manufacturing practices yield consistent, high-quality cannabis, providing industry-leading product selection to both the medical and legal adult-use market. The Company owns a number of synergistic businesses and brands, including The Apothecarium, Ilera Healthcare, State Flower, Valhalla Confections, and Arise Bioscience Inc. For more information, visit www.terrascend.com.

Notice Regarding Forward Looking Statements

This press release contains “forward-looking statements” and “forward-looking information” within the meaning of applicable U.S. and Canadian securities laws (collectively, “forward-looking statements”), which involve certain known and unknown risks and uncertainties. Forward-looking statements predict or describe our future operations, business plans, business and investment strategies and the performance of our investments. These forward-looking statements are generally identified by their use of such terms and phrases as “intend,” “goal,” “strategy,” “estimate,” “expect,” “project,” “projections,” “forecasts,” “plans,” “seeks,” “anticipates,” “potential,” “proposed,” “will,” “should,” “could,” “would,” “may,” “likely,” “designed to,” “foreseeable future,” “believe,” “scheduled” and other similar expressions. You are cautioned not to place undue reliance on these forward-looking statements, which speak only as of the date the statement was made. Forward–looking statements are necessarily based upon a number of estimates and assumptions that, while considered reasonable by management, are inherently subject to significant business, economic and competitive risks, financial results, results, performance or achievements expressed or implied by those forward–looking statements and the forward–looking statements are not guarantees of future performance. Accordingly, there are or will be important factors that could cause actual outcomes or results to differ materially from those indicated in these statements. A discussion of some of the material factors applicable to Canopy Growth Corporation (“Canopy”) can be found under the section entitled “Risk Factors” in Canopy’s Annual Report on Form 10-K for the year ended March 31, 2020, filed with the Securities and Exchange Commission and with applicable Canadian securities regulators, as such factors may be further updated from time to time in its periodic filings with the Securities and Exchange Commission and with applicable Canadian securities regulators, which can be accessed at www.sec.gov/edgar and www.sedar.com, respectively. These factors should not be construed as exhaustive and should be read in conjunction with the other cautionary statements that are included in this press release and in the filings. Any forward–looking statement included in this press release is made as of the date of this press release and, except as required by law, Canopy disclaims any obligation to update or revise any forward– looking statement. Readers are cautioned not to put undue reliance on any forward–looking statement. Forward-looking statements contained in this press release are expressly qualified by this cautionary statement.

Cision View original content to download multimedia:http://www.prnewswire.com/news-releases/canopy-growth-and-terrascends-arise-bioscience-enter-debt-financing-agreement-301190803.html

SOURCE Canopy Growth Corporation

Nickel Creek Platinum Identifies Eleven New Geophysical Anomalies From Extensive Geophysics Program And Announces Results From Limited 2020 Drill Program

PR Newswire

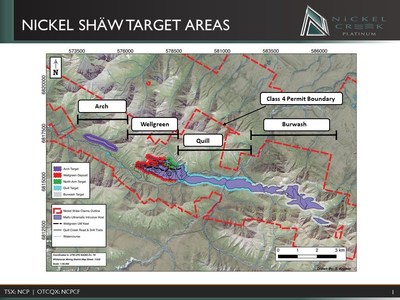
TORONTO, Dec. 10, 2020 /PRNewswire/ – Nickel Creek Platinum Corp. (TSX: NCP) (“Nickel Creek” or the “Company”) is pleased to announce the results of its 2020 ground-based Electromagnetic (EM) geophysics and drilling program at its 100%-owned Nickel Shäw Project located in the Yukon, Canada.  Using a large loop transient electromagnetic (TEM) survey, the 2020 program tested the Arch and Burwash exploration target areas, which are along trend approximately 2.0 kilometres to the northwest and 5.0 kilometres southeast (respectively) of the main Wellgreen deposit.  This program resulted in identification of 42 conductive anomalies, with 11 of these determined to be potentially massive nickel sulphide.

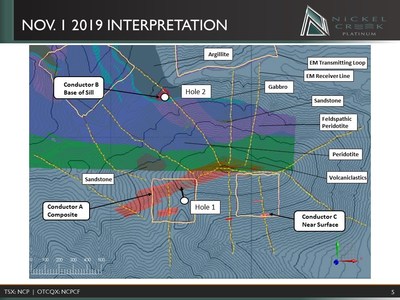
In addition to the TEM survey, a limited, 2-hole diamond drilling program totalling 675 metres was carried out at the Quill area, located 1.7 kilometres southeast of the Wellgreen deposit. This drilling tested 2 conductors, A and B, detected during the 2019 TEM survey of the Quill area. See Figure 1 for a property scale map of the Nickel Shäw Project area.  With no significant nickel-copper (Ni-Cu) sulphide intersected in either Conductor A or B and assay results yielding no well-mineralized intervals, the Company will now focus on the higher priority targets identified in the Arch and Burwash target areas.

Stuart Harshaw, President and CEO of Nickel Creek commented: “The focus of the 2019 and 2020 programs was to perform an EM survey over the entire Nickel Shäw Project area in order to identify potential high grade nickel targets within the prospective ultramafic rock unit. The survey was highly successful in identifying over 40 conductive targets.  The limited 2020 drill program also improved our understanding of the geology in the area, allowing the Company to prioritize 11 highly conductive targets for future exploration.”  


2020 Quill Drill Program

The primary target for the 2020 drill exploration program was Conductor A, which has a strike length of 800 metres and is a composite of several conductive plates. This conductor has conductance of 5,000 Siemens and a depth to top of 200 metres below surface. The drill hole testing of Conductor A was approximately 561 metres and was collared in Station Creek Formation volcanics and drilled through Hasen Creek Formation sediments before encountering the peridotite sill. Based on observations in the core and the borehole EM survey, the conductivity appears to be centred above the hole and caused by sheared graphitic sediments. Geological mapping and drill core observations suggest the sequence is overturned and that the footwall of the sill was cut by the drill hole.  The second hole drill tested Conductor B for approximately 114 metres, and Conductor B was drilled entirely in serpentinized peridotite. The conductivity at Conductor B appeared to be related to a superparamagnetic response in the peridotite and was later confirmed with borehole geophysics. See Figure 2.


2020 EM Survey

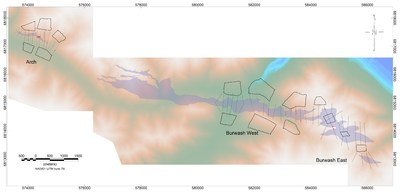
Sixteen loops were used in the 2020 campaign, covering 29 kilometres of data on 42 separate lines.  The data collection was completed by SJ Geophysics from Vancouver British Columbia (see Figure 3 below for a survey overview).  Receivers recorded readings at each 25-metre station utilizing two separate loops transmitting simultaneously at 3.75 and 5.625 Hertz.

 The 2020 EM program identified 42 total conductive anomalies, with 11 of these identified as potentially nickel massive sulphide.  The 11 conductors are generally in the size range of 20 metres x 30 metres with the largest up to 50 metres x 75 metres, and are very highly conductive (up to 26,000 Siemens).  Given the reading size of the modelled conductors, the possibility exists that a larger, highly fractured or cluster of similar conductors exists in the vicinity of each target, but only the closest conductor to each survey line can be identified.

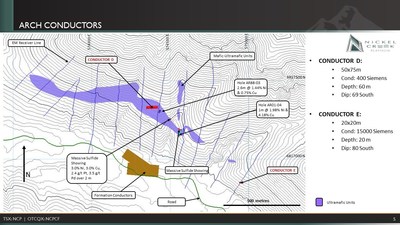
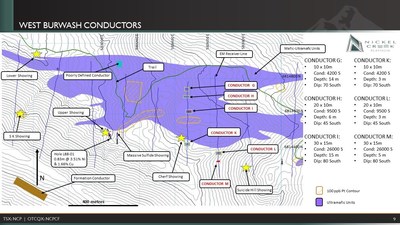
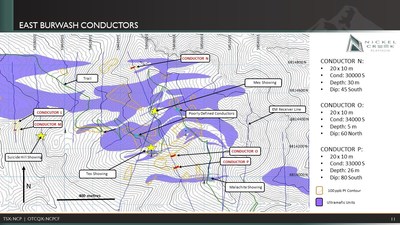
Dissimilar to Conductor A identified during the 2019 exploration program, several of the 2020 identified conductors have a close spatial association with mapped Ni-Cu sulphide occurrences in outcrop and historic drill holes. The conductor locations, parameters and Ni-Cu sulphide occurrences identified during the 2020 exploration program are shown in Figures 4 – 6.

 Conductor D, located in the Arch area (see Figure 4), represents a highly promising EM conductor for potential follow-up work given its size and direct correlation with high grade surface showings of Ni-Cu sulphide. The conductor is also supported by two shallow historic drill intersections of Ni-Cu sulphide within 250 metres of the conductor. One of the nearby surface showings had historic channel samples grading up to 3.0% Ni, 3.0% Cu, 2.4 g/t Pt and 3.5 g/t Pd over 2.0 metres. A historic 1988 drill hole, AR88-03, intersected 1.4% Ni and 0.8% Cu over 2.6 metres (core length) at 14 metres down-hole. A 2001 historic drill hole, AR01-04, intersected 2.0% Ni and 4.2% Cu over 1 metre (core length) at 55 metres down-hole. Conductor D can be tested by one or more holes drilled from a ridge to the south-southeast. Conductor E occurs approximately 700 metres along the trend of the ultramafic sill to the southeast of Conductor D. This highly conductive body does not have mapped ultramafic or associated Ni-Cu sulphide showings. An example of the learning from the 2020 Drill Program is that a larger conductor that was detected approximately 250 metres south of the ultramafic sill, brown rectangles in Figure 4, has similarities to Conductor A and is believed to be formational (likely graphite bearing) in nature and therefore there are no current plans to test it further.

 The West Burwash area has several Ni-Cu sulphide showings at margins of the main ultramafic intrusion and subsidiary splays. (see Figure 5 above). The Lower and Upper Showings are both exposed along Linda Creek in the western part of the intrusion. A 1954 historic drill hole at the Lower Showing intersected 4.2% Ni, 1.8% Cu, 4.1 g/t Pt and 4.8 g/t Pd over 0.36 metres (core length) at a gabbro contact. Mapping and drilling in the 1980s at the Upper Showings returned a historic surface chip sample grading 1.8% Ni, 1.0% Cu, 2.2 g/t Pt and 1.6 g/t Pd over 1.3 metres and a historic drill intersection (hole L88-01) grading 3.5% Ni, 1.7% Cu, 2.7 g/t Pt and 4.4 g/t Pd over 0.83 metres (core length). This mineralization consists of semi-massive and massive sulphide at a gabbro/sediment contact. At the Cherf Showing, located 400 metres east of the Upper Showing, historic surface grab samples returned up to 0.16% Ni, 0.22% Cu, 0.9 g/t Pt and 1.0 g/t Pd at a gabbro/limestone contact. The Suicide Hill Showing, located 400 metres southeast from the Cherf Showing, has historic surface grab samples up to 0.07% Ni, 0.39% Cu, 1.5 g/t Pt and 0.5 g/t Pd from sheared metavolcanics.  Six highly conductive targets occur on two basic groupings in West Burwash.  Conductors G-H-I occur in the centre of the intrusion with no mapped Ni-Cu sulphide mineralization located nearby.  Conductors K-L-M occur along what is interpreted as the base of the intrusion (from mapping and the stratigraphic section) with Conductor K located approximately 50 metres from the Cherf Showing.  A formation type conductor, believed to be similar in nature to Conductor A, was detected 600 metres southwest of the intrusion.

 Two historic showings occur in the East Burwash area. The Tex and Mex showings were discovered during mapping and soil sampling work in the 1980s and are characterized by disseminated sulphide mineralization in gabbro and sheared gabbro. A historic surface chip sample at Mex graded 0.5% Ni, 0.5% Cu, 1.4 g/t Pt and 1.6 g/t Pd over 6.0 metres. Conductors O and P occur approximately 200 metres southeast of the Tex Showings adjacent to historic multi-element soil anomalies outlined by the 100 ppb Pt contour in Figure 6. These conductors lie between mapped ultramafic units, but are not underlain by ultramafic or gabbro.

Stuart Harshaw, President and CEO of Nickel Creek further commented: “The close spatial association of the conductors, combined with historical drilling and surface showings, is highly encouraging.  Any exploration drilling programs considered for 2021 should represent an opportunity to further test the potential of the Nickel Shäw property to host high-grade Ni-Cu massive sulphide that would enhance the large well-defined mineralization of the Wellgreen deposit.”

The scientific and technical information disclosed in this news release in relation to the geophysics program was reviewed and approved by Brian Bengert, P. Geo., who is a “Qualified Person” as defined in National Instrument 43-101 – Standards of Disclosure for Mineral Projects (“NI 43-101”), and an independent consultant to the Company.  All geographical information in the above are given in the NAD 83, Zone 7N coordinate system.  All other scientific and technical information disclosed in this news release was reviewed and approved by Cam Bell, Nickel Creek’s Consulting Geologist and a “Qualified Person” as defined in NI 43-101. The reported historic exploration results have not been verified by a Qualified Person and do not indicate the grades and widths of future exploration. Much of the historic exploration work discussed in this News Release is documented in the following Yukon Assessment Reports:

  • Cathro, R.J. (1987) Summary Report on 1987 Exploration: Linda Property; Performed for 2001 Resource Industries Limited, Rockridge Mining Corporation and Kluane Joint Venture by Archer Cathro and Associates Limited (Yukon Assessment Report 87-006).
  • Eaton, W.D. (1988) Summary Report on 1988 Exploration: Linda Property; Performed for 2001 Resource Industries Limited, Rockridge Mining Corporation and Kluane Joint Venture by Archer Cathro and Associates Limited (Yukon Assessment Report 99-092633).
  • McGoran, J.P. (2001) Prospecting, Road Maintenance, Trenching and Drilling Report on 2001 Exploration: Arch Property; Performed for the Linda Joint Venture by Northern Platinum Limited (Yukon Assessment Report 2001-094254).

About Nickel Creek Platinum Corp.

Nickel Creek Platinum Corp. (TSX: NCP; OTCQB: NCPCF) is a Canadian mining exploration and development company and its flagship asset is its 100%-owned Nickel Shäw Project.  The Nickel Shäw Project is a large undeveloped nickel sulphide project in one of the most favourable jurisdictions in the world, with a unique mix of metals including copper, cobalt and platinum group metals. The Nickel Shäw Project has exceptional access to infrastructure, located three hours west of Whitehorse via the paved Alaska Highway, which further offers year-round access to deep-sea shipping ports in southern Alaska.  The Company is also investigating other opportunities for shareholder value creation.

The Company is led by a management team with a proven track record of successful discovery, development, financing and operation of large-scale projects. Our vision is to create value for our shareholders by becoming a leading North American nickel, copper, cobalt and PGM producer.

Cautionary Note Regarding Forward-Looking Information

This news release includes certain information that may be deemed “forward-looking information”. Forward-looking information can generally be identified by the use of forward-looking terminology such as “may”, “will”, “expect”, “intend”, “believe”, “continue”, “plans” or similar terminology, or negative connotations thereof. All information in this release, other than information of historical facts, including, without limitation, regarding the undertaking of future activities, work programs and development of the Nickel Shäw Project, realization of the potential of the various Conductors, and general future plans and objectives for the Company and the Nickel Shäw Project, are forward-looking information that involve various risks and uncertainties. Although the Company believes that the expectations expressed in such forward-looking information are based on reasonable assumptions, such expectations are not guarantees of future performance and actual results or developments may differ materially from those in the forward-looking information.

For more information on the Company and the key assumptions, risks and challenges with respect to the forward-looking information discussed herein, and about our business in general, investors should review the Company’s most recently filed annual information form, and other continuous disclosure filings which are available at www.sedar.com. Readers are cautioned not to place undue reliance on forward-looking information. The Company does not undertake to update any forward-looking information, except in accordance with applicable securities laws.

Cision View original content to download multimedia:http://www.prnewswire.com/news-releases/nickel-creek-platinum-identifies-eleven-new-geophysical-anomalies-from-extensive-geophysics-program-and-announces-results-from-limited-2020-drill-program-301190753.html

SOURCE Nickel Creek Platinum Corp.

Colony Bankcorp Implements Branch Network Realignment Focused on Optimal Delivery and Cost-effective Operations

Colony Bankcorp Implements Branch Network Realignment Focused on Optimal Delivery and Cost-effective Operations

FITZGERALD, Ga.–(BUSINESS WIRE)–
Colony Bankcorp, Inc. (Nasdaq: CBAN) (“Colony” or the “Company”), the bank holding company for Colony Bank (the “Bank”), today announced the strategic realignment of its branch network. As part of the realignment, select Colony Bank branches will be consolidated, resulting in the closure of five branches, or a total of 18% of the Bank’s branch network. The branches to be closed consist of one branch located in each of the Columbus, Douglas, Fitzgerald, Savannah and Valdosta markets, effective March 19, 2021. After the closures, Colony will continue to operate one branch location in each of the aforementioned markets except for the Savannah market, where Colony will operate two branch locations. Customers affected by the closures will receive additional information.

Commenting on the announcement, Heath Fountain, President and Chief Executive Officer, said, “Branch closing decisions are never made easily. As part of our commitment to meeting the needs of our customers and communities, we continuously review our branch network to ensure that all branches operate in the most efficient and cost-effective manner possible. This detailed analysis, which included usage, proximity to other Colony branches and the changing needs of customers, identified five branches that could be combined with other Colony branches in close proximity, while continuing to uphold the exceptional level of service for which Colony Bank is known. The closure of the branches will have little effect on our balance sheet, and will reduce our operating expenses by approximately $1 million per year, allowing us to continue to invest more in our popular digital banking channels. We are confident that this realignment of our branch network will better position Colony Bank to meet the growing and changing needs of our customers, team members and communities.”

About Colony Bankcorp

Colony Bankcorp, Inc. is the bank holding company for Colony Bank. Founded in 1975 and headquartered in Fitzgerald, Georgia, Colony operates 33 locations throughout Georgia. The Homebuilder Finance Division helps the local construction industry with building and construction loans, and the Small Business Specialty Lending Division assists small businesses with government guaranteed loans. The Bank also helps its customers achieve their goal of home ownership through Colony Bank Mortgage. Colony’s common stock is traded on the NASDAQ Global Market under the symbol “CBAN.” For more information, please visit www.colony.bank. You can also follow the Company on Facebook or on Twitter @colony_bank.

Forward-Looking Statements

This news release contains “forward-looking statements” as defined in the Private Securities Litigation Reform Act of 1995. In general, forward-looking statements usually use words such as “may,” “believe,” “expect,” “anticipate,” “intend,” “will,” “should,” “plan,” “estimate,” “predict,” “continue” and “potential” or the negative of these terms or other comparable terminology, including statements related to the leadership of the Company or the future performance of the Company. Forward-looking statements represent management’s beliefs, based upon information available at the time the statements are made, with regard to the matters addressed; they are no guarantees of future performance. Forward‑looking statements are subject to numerous assumptions, risks and uncertainties that change over time and could cause actual results or financial condition to differ materially from those expressed in or implied by such statements. You should not place undue reliance on such forward-looking statements. The Company undertakes no obligation to update such forward-looking statements to reflect events or circumstances occurring after the issuance of this press release.

T. Heath Fountain

President & CEO

(229) 426-6000 (Ext. 6012)

KEYWORDS: United States North America Georgia

INDUSTRY KEYWORDS: Banking Professional Services Finance

MEDIA:

Logo
Logo

ROSEN, A GLOBAL AND LEADING LAW FIRM, Reminds Intercept Pharmaceuticals, Inc. Investors of Important Deadline in Securities Class Action – ICPT

NEW YORK, Dec. 10, 2020 (GLOBE NEWSWIRE) — Rosen Law Firm, a global investor rights law firm, reminds purchasers of the securities of Intercept Pharmaceuticals, Inc. (NASDAQ: ICPT) between September 28, 2019 and October 7, 2020, inclusive (the “Class Period”), of the important January 4, 2021 lead plaintiff deadline in the securities class action. The lawsuit seeks to recover damages for Intercept investors under the federal securities laws.

To join the Intercept class action, go to http://www.rosenlegal.com/cases-register-1973.html or call Phillip Kim, Esq. toll-free at 866-767-3653 or email [email protected] or [email protected] for information on the class action.

According to the lawsuit, defendants throughout the Class Period made false and/or misleading statements and/or failed to disclose that: (1) defendants downplayed the true scope and severity of safety concerns associated with Ocaliva’s (obeticholic acid (“OCA”)) use in treating primary biliary cholangitis; (2) the foregoing increased the likelihood of an FDA investigation into Ocaliva’s development, thereby jeopardizing Ocaliva’s continued marketability and the sustainability of its sales; (3) any purported benefits associated with OCA’s efficacy in treating nonalcoholic steatohepatitis (“NASH”) were outweighed by the risks of its use; (4) as a result, the FDA was unlikely to approve Intercept’s New Drug Application for OCA in treating patients with liver fibrosis due to NASH; and (5) as a result of the foregoing, defendants’ positive statements about Intercept’s business, operations, and prospects were materially misleading and/or lacked a reasonable basis. When the true details entered the market, the lawsuit claims that investors suffered damages.

A class action lawsuit has already been filed. If you wish to serve as lead plaintiff, you must move the Court no later than January 4, 2021. A lead plaintiff is a representative party acting on behalf of other class members in directing the litigation. If you wish to join the litigation, go to http://www.rosenlegal.com/cases-register-1973.html or to discuss your rights or interests regarding this class action, please contact Phillip Kim, Esq. of Rosen Law Firm toll free at 866-767-3653 or via e-mail at [email protected] or [email protected].

NO CLASS HAS YET BEEN CERTIFIED IN THE ABOVE ACTION. UNTIL A CLASS IS CERTIFIED, YOU ARE NOT REPRESENTED BY COUNSEL UNLESS YOU RETAIN ONE. YOU MAY RETAIN COUNSEL OF YOUR CHOICE. YOU MAY ALSO REMAIN AN ABSENT CLASS MEMBER AND DO NOTHING AT THIS POINT. AN INVESTOR’S ABILITY TO SHARE IN ANY POTENTIAL FUTURE RECOVERY IS NOT DEPENDENT UPON SERVING AS LEAD PLAINTIFF.

Follow us for updates on LinkedIn: https://www.linkedin.com/company/the-rosen-law-firm, on Twitter: https://twitter.com/rosen_firm or on Facebook: https://www.facebook.com/rosenlawfirm/.

Rosen Law Firm represents investors throughout the globe, concentrating its practice in securities class actions and shareholder derivative litigation. Rosen Law Firm was Ranked No. 1 by ISS Securities Class Action Services for number of securities class action settlements in 2017. The firm has been ranked in the top 3 each year since 2013. Rosen Law Firm has achieved the largest ever securities class action settlement against a Chinese Company. Rosen Law Firm’s attorneys are ranked and recognized by numerous independent and respected sources. Rosen Law Firm has secured hundreds of millions of dollars for investors. Attorney Advertising. Prior results do not guarantee a similar outcome.

Contact Information:

        Laurence Rosen, Esq.
        Phillip Kim, Esq.
        The Rosen Law Firm, P.A.
        275 Madison Avenue, 40th Floor
        New York, NY 10016
        Tel: (212) 686-1060
        Toll Free: (866) 767-3653
        Fax: (212) 202-3827
        [email protected]
        [email protected]
        [email protected]
        www.rosenlegal.com


Globis Acquisition Corp. Announces Pricing of $100 Million Initial Public Offering

New York, NY, Dec. 10, 2020 (GLOBE NEWSWIRE) — Globis Acquisition Corp. (NASDAQ: GLAQU, the “Company”) announced today that it priced its initial public offering of 10,000,000 units at $10.00 per unit. The units are expected to be listed on The Nasdaq Capital Market (“NASDAQ”) and trade under the ticker symbol “GLAQU” beginning on December 11, 2020. Each unit consists of one share of common stock and one redeemable warrant to purchase one share of common stock at $11.50 per share. Once the securities comprising the units begin separate trading, the common stock and warrants are expected to be listed on NASDAQ under the symbols “GLAQ” and “GLAQW”, respectively.

The offering is expected to close on December 15, 2020, subject to customary closing conditions.

Chardan acted as sole book running manager in the offering. The underwriters have been granted a 45-day option to purchase up to an additional 1,500,000 units offered by the Company to cover over-allotments, if any.

A registration statement relating to these securities was declared effective by the Securities and Exchange Commission on December 10, 2020. The offering is being made only by means of a prospectus, copies of which may be obtained, when available, by contacting Chardan, 17 State Street, 21st floor, New York, New York 10004. Copies of the registration statement can be accessed through the SEC’s website at www.sec.gov.

This press release shall not constitute an offer to sell or a solicitation of an offer to buy, nor shall there be any sale of these securities in any state or jurisdiction in which such offer, solicitation or sale would be unlawful prior to registration or qualification under the securities laws of any such state or jurisdiction.

About Globis Acquisition Corp.

Globis Acquisition Corp. is a blank check company formed for the purpose of effecting a merger, share exchange, asset acquisition, share purchase, reorganization or similar business combination with one or more businesses. Globis Acquisition Corp. intends to focus its search on a target business that will benefit from trends toward economic globalization, particularly as it affects emerging markets. The proceeds of the offering will be used to fund such business combination.

Forward Looking Statements

This press release includes forward-looking statements that involve risks and uncertainties. Forward looking statements are statements that are not historical facts. Such forward-looking statements, including the successful consummation of the Company’s initial public offering, are subject to risks and uncertainties, which could cause actual results to differ from the forward looking statements. The Company expressly disclaims any obligation or undertaking to release publicly any updates or revisions to any forward-looking statements contained herein to reflect any change in the Company’s expectations with respect thereto or any change in events, conditions or circumstances on which any statement is based, except as required by law.

Contact:

Hayden IR
Brett Maas
(646) 536-7331
[email protected]


Biodesix Announces Third Quarter 2020 Results and Provides Corporate Update

Biodesix Announces Third Quarter 2020 Results and Provides Corporate Update

Generates record quarterly revenue of $9.2 million

Raises net proceeds of $63 million through initial public offering

Adds to the significant and growing body of evidence demonstrating the clinical value of its portfolio of blood based diagnostic tests for lung disease

BOULDER, Colo.–(BUSINESS WIRE)–
Biodesix, Inc. a leading data-driven diagnostic solutions company with a focus in lung disease, today announced financial and operating results for the third quarter ended September 30, 2020 and provided a corporate update.

Third Quarter 2020 and Recent Highlights

  • Generated record quarterly revenue of $9.2 million for the third quarter ended September 30, 2020.
  • Completed initial public offering (IPO) that raised net proceeds of approximately $63 million after deducting offering costs, underwriting discounts and commissions.
  • Announced a strategic partnership with the Big Ten Conference whereby Biodesix is conducting ddPCR™ COVID-19 validation testing and managing the onsite testing of rapid antigen SARS-CoV-2 testing for all student-athletes and staff personnel involved in close contact sports competition.
  • Published an extended analysis of data from the company’s Nodify XL2® lung nodule test in the American College of Chest Physicians (CHEST) Journal. The data demonstrate that all nodules in the study group that were established as benign after one year remained benign after two years, the guideline-recommended surveillance period to radiologically confirm a benign diagnosis.
  • Presented data from three studies at the American College of Chest Physicians (CHEST 2020) Annual Meeting highlighting the clinical value of the company’s Nodify XL2® and Nodify CDT™ lung nodule risk assessment tests.

“We recently achieved a very significant milestone with our IPO and transition to a public company,” stated Scott Hutton, Chief Executive Officer of Biodesix. “With the proceeds from the offering, we plan to continue to market our suite of commercially available diagnostic tests, including our Biodesix Lung Reflex® and Nodify Lung™ testing strategies, in addition to our COVID-19 testing, while also investing in the discovery, development, and validation of innovative new tests leveraging our proprietary AI-driven discovery platform.

“We continue to monitor the COVID-19 pandemic carefully in light of the recent surge in case counts around the country, and we are pleased to be able to play an important part in the fight against this dangerous virus through our WorkSafe testing program. To this point, our lung disease-focused core business continues to perform well even while healthcare facilities devote time and resources to combat COVID-19 and travel restrictions affect our commercial efforts. We believe this is a testament to the valuable clinical information that our tests provide along critical points of the lung disease care continuum,” concluded Mr. Hutton.

Financial Results

Revenue. Revenue for the three months ended September 30, 2020 was $9.2 million, as compared to $3.9 million for the comparable period in 2019, an increase of 133%. This increase was due to $5.5 million of revenue from our two COVID-19 diagnostic tests, partially offset by a modest decline in our non-COVID-19 diagnostic test volumes of $0.7 million as health care practitioners, including pulmonologists, were increasingly diverted to pandemic-related care. In addition, company sales efforts continued to be impacted by travel and other COVID-19 pandemic related restrictions. Revenue for the nine months ended September 30, 2020 was $18.5 million, as compared to $16.3 million for the comparable period in 2019, an increase of 14%.

Direct costs and expenses. Direct costs and expenses for the three months ended September 30, 2020 were $3.9 million, as compared to $1.5 million for the comparable period of 2019, an increase of 159%. Direct costs and expenses for the nine months ended September 30, 2020 were $7.3 million compared to $4.2 million for the nine months ended September 30, 2019, an increase of 73%. The increase in costs were primarily driven by the release of the company’s Nodify CDT™ test and its COVID-19 testing program in 2020.

Research and development. Research and development expenses for the three months ended September 30, 2020 were $2.7 million, as compared to $2.4 million for the comparable period in 2019, an increase of 15%. Research and development expenses for the nine months ended September 30, 2020 were $7.7 million, as compared to $8.0 million for the comparable period in 2019, a decrease of 3%.

Sales, marketing, general and administrative. Sales, marketing, general and administrative expenses for the three months ended September 30, 2020 were $7.9 million, as compared to $8.2 million for the comparable period in 2019, a decrease of 4%. Sales, marketing, general and administrative expenses for the nine months ended September 30, 2020 were $22.8 million, as compared to $24.1 million for the comparable period in 2019, a decrease of 5%. The decrease was driven by reductions in travel and related expenses as the COVID-19 pandemic reduced or eliminated the travel and related expenses.

Operating loss. Operating loss for the three months ended September 30, 2020 was $6.2 million, as compared to an operating loss of $9.0 million for the comparable period in 2019, a decrease of 31%. Operating loss for the nine months ended September 30, 2020 was $20.3 million, as compared to an operating loss of $23.2 million for the comparable period in 2019, a decrease of 13%. The decrease was due in part to higher revenue in the third quarter of 2020 as compared to the third quarter of 2019.

Net loss. Net loss for the three months ended September 30, 2020 was $8.9 million, as compared to $9.6 million for the comparable period in 2019, a decrease of 8%. Net loss for the nine months ended September 30, 2020 was $26.8 million, as compared to $24.2 million for the comparable period in 2019, an increase of 11%.

Cash and cash equivalents. As of September 30, 2020, the company held cash and cash equivalents of $6.3 million, as compared to $5.3 million as of December 31, 2019. Subsequent to the end of the third quarter, the company completed a successful initial public offering that raised net proceeds of approximately $63 million. As a result of the completion of the initial public offering, the company estimates that it has sufficient cash resources to meet its cash obligations through at least the next 12 months.

About Biodesix

Biodesix is a leading diagnostic company with a focus in lung disease. The company develops diagnostic tests addressing important clinical questions by combining multi-omics through the power of artificial intelligence. Biodesix is the first company to offer six non-invasive tests for patients with diseases of the lung. Biodesix launched the SARS-CoV-2 ddPCR™ test and the Platelia SARS-CoV-2 Total Ab in response to the global pandemic and virus that impacts the lung and causes COVID-19. The blood based Biodesix Lung Reflex® strategy for lung cancer patients integrates the GeneStrat® and VeriStrat® tests to support treatment decisions with results in 72 hours, expediting time to treatment. The blood based Nodify Lung™ nodule risk assessment testing strategy, consisting of the Nodify XL2® and the Nodify CDT™ tests, evaluates the risk of malignancy in incidental pulmonary nodules, enabling physicians to better triage patients to the most appropriate course of action. Biodesix also collaborates with many of the world’s leading biotechnology and pharmaceutical companies to solve complex diagnostic challenges in lung disease. For more information about Biodesix, visit biodesix.com.

Note Regarding Forward-Looking Statements

This press release may contain forward-looking statements that involve substantial risks and uncertainties for purposes of the safe harbor provided by the Private Securities Litigation Reform Act of 1995. All statements contained in this press release other than statements of historical fact, are forward-looking statements. The words “believe,” “may,” “will,” “estimate,” “continue,” “anticipate,” “intend,” “plan,” “expect,” “predict,” “potential,” “opportunity,” “goals,” or “should,” and similar expressions are intended to identify forward-looking statements. Such statements are based on management’s current expectations and involve risks and uncertainties. Actual results and performance could differ materially from those projected in the forward-looking statements as a result of many factors. Biodesix has based these forward-looking statements largely on its current expectations and projections about future events and trends. These forward-looking statements are subject to a number of risks, uncertainties and assumptions. Forward-looking statements may include information concerning the impact of the COVID-19 pandemic on Biodesix and its operations, its possible or assumed future results of operations, including descriptions of its revenues, profitability, outlook and overall business strategy. Forward-looking statements are inherently subject to risks and uncertainties, some of which cannot be predicted or quantified. Factors that could cause actual results to differ materially from those contemplated in this press release can be found in the Risk Factors section of Biodesix’s public filings with the Securities and Exchange Commission, including Biodesix’s final prospectus filed on October 29, 2020 under Rule 424(b)(4) in connection with the company’s initial public offering. Biodesix undertakes no obligation to revise or publicly release the results of any revision to such forward-looking statements, except as required by law. Given these risks and uncertainties, readers are cautioned not to place undue reliance on such forward-looking statements. All forward-looking statements are qualified in their entirety by this cautionary statement.


Biodesix, Inc.

Consolidated Balance Sheet (unaudited)

(in thousands, except per share data)


September 30,

2020


December 31,

2019


Assets


Current assets


Cash and cash equivalents


$

6,348


$

5,286


Accounts receivable


5,396


5,292


Other current assets


6,405


2,122


Total current assets


18,149


12,700


Non‑current assets


Property and equipment, net


3,005


2,120


Intangible assets, net


13,667


15,092


Deposits


95


90


Goodwill


11,631


11,631


Total non‑current assets


28,398


28,933


Total assets


$

46,547


$

41,633


Liabilities and Stockholders’ Deficit


Current liabilities


Accounts payable


$

3,485


$

1,717


Accrued liabilities


6,953


4,180


Deferred revenue


5,673


1,283


Convertible notes payable


26,600


12,159


Current portion of note payable


7,202


Put option liability


6,650


3,261


Total current liabilities


56,563


22,600


Non‑current liabilities


Warrant liability


403


329


Other liabilities


392


358


Long‑term notes payable


17,236


23,812


Paycheck protection program note payable


3,099


Contingent consideration


30,071


29,114


Total non‑current liabilities


51,201


53,613


Total liabilities


107,764


76,213


Commitments and contingencies


Convertible Preferred stock


Convertible preferred stock, $0.001 par value, 185,432,719 (2020) and 174,237,067 (2019) authorized; 118,766,273 (2020 and 2019) issued and outstanding; liquidation preference of $202,582 (2020 and 2019)


193,959


193,959


Stockholders’ deficit


Common stock, $0.001 par value, 220,000,000 (2020) and 190,000,000 (2019) authorized; 289,508 (2020) and 254,918 (2019) issued and outstanding


2


1


Additional paid‑in capital


2,503


2,324


Accumulated deficit


(257,681

)


(230,864

)

Total stockholders’ deficit


(255,176

)


(228,539

)

Total liabilities, convertible preferred stock, and stockholders’ deficit


$

46,547


$

41,633


Biodesix, Inc.

Condensed Statements of Operations (unaudited)

(in thousands, except share data)


Three Months Ended


Nine Months Ended


September 30,


September 30,


2020


2019


2020


2019


Revenues


$

9,193


$

3,942


$

18,528


$

16,281


Operating expenses


Direct costs and expenses


3,891


1,503


7,346


4,244


Research and development


2,706


2,359


7,713


7,966


Sales, marketing, general and administrative


7,879


8,212


22,793


24,080


Accretion of contingent consideration


957


896


2,901


2,525


Change in fair value of contingent consideration


(1,944

)


663


Total operating expenses


15,433


12,970


38,809


39,478


Loss from operations


(6,240

)


(9,028

)


(20,281

)


(23,197

)


Interest expense


(2,658

)


(706

)


(6,899

)


(2,005

)

Other income, net


53


133


363


1,001


Net loss


$

(8,845

)


$

(9,601

)


$

(26,817

)


$

(24,201

)

Net loss per share, basic and diluted


$

(31.93

)


$

(39.35

)


$

(99.69

)


$

(103.87

)

Weighted-average shares outstanding, basic and diluted


277


244


269


233


Media:

Jordona Jackson Smith for Biodesix

[email protected]

(805) 674-7347

Investors:

Jeremy Feffer

[email protected]

(212) 915-2568

KEYWORDS: Colorado United States North America

INDUSTRY KEYWORDS: Health Infectious Diseases Clinical Trials Research Science Biotechnology

MEDIA:

Logo
Logo

SHAREHOLDER ALERT: WeissLaw LLP Investigates Silver Spike Acquisition Corp.

PR Newswire

NEW YORK, Dec. 10, 2020 /PRNewswire/ — WeissLaw LLP is investigating possible breaches of fiduciary duty and other violations of law by the board of directors of Silver Spike Acquisition Corp. (“SSPK” or the “Company”) (NASDAQ: SSPK) in connection with the Company’s proposed merger with WM Holding Company, LLC (“WMH”), which operates Weedmaps, an online listings marketplace for cannabis consumers and businesses, and WM Business, a software as a service subscription offering sold to cannabis retailers and brands.  Under the terms of the merger agreement, SSPK will acquire WMH through a reverse merger that will result in WMH becoming a public company traded on the NASDAQ.  The estimated post-transaction equity value of the combined company is approximately $1.5 billion.


If you own SSPK shares and wish to discuss this investigation or have any questions concerning this notice or your rights or interests, visit our website:


https://www.weisslawllp.com/SSPK/


Or please contact:


Joshua Rubin, Esq.

WeissLaw LLP
1500 Broadway, 16th Floor
New York, NY  10036
(212) 682-3025
(888) 593-4771
[email protected]

WeissLaw is investigating whether SSPK’s board acted in the best interest of SSPK’s public stockholders in agreeing to the proposed transaction, whether the board was fully informed as to the valuation of WMH, and whether all information regarding the process undertaken by the board and the valuation of the transaction will be fully and fairly disclosed to SSPK’s public stockholders. 

WeissLaw LLP has litigated hundreds of stockholder class and derivative actions for violations of corporate and fiduciary duties.  We have recovered over a billion dollars for defrauded clients and obtained important corporate governance relief in many of these cases.  If you have information or would like legal advice concerning possible corporate wrongdoing (including insider trading, waste of corporate assets, accounting fraud, or materially misleading information), consumer fraud (including false advertising, defective products, or other deceptive business practices), or anti-trust violations, please email us at [email protected]

Cision View original content to download multimedia:http://www.prnewswire.com/news-releases/shareholder-alert-weisslaw-llp-investigates-silver-spike-acquisition-corp-301190882.html

SOURCE WeissLaw LLP

LMP Automotive Holdings, Inc. Engages Truist Securities, Inc. as the Lead Arranger for up to a $660M Syndicated Senior Credit Facilities

FORT LAUDERDALE, Fla., Dec. 10, 2020 (GLOBE NEWSWIRE) — LMP Automotive Holdings, Inc. (NASDAQ: LMPX) (the “Company” or “LMP”), an e-commerce and facilities-based platform for consumers who desire to buy, sell, subscribe to or finance pre-owned and new automobiles, today announced it has engaged Truist Securities, Inc. as the Lead Arranger for up to a $660 million Syndicated Senior Credit Facilities.

Sam Tawfik, LMP’s Chief Executive Officer stated, “We chose to partner with Truist because they have proven their leadership in the syndicated and leveraged finance market, accompanied by their strong industry expertise financing growth-oriented dealer platforms, Automotive Retail Investment Banking, Dealer Commercial Services, Dealer Retail Services, Fleet Leasing and Structured Real Estate.”

Evan Bernstein, LMP’s Chief Financial Officer stated, “This prospective senior credit facility can provide additional financial flexibility to support our acquisitions and business strategy. We want to thank Truist and their team for their support.” Mr. Bernstein added, “The facility can also provide additional borrowing availability, increased financial flexibility consisting of the new vehicle floor plan, used vehicle floor plan and a revolving credit facility. We expect the rates and terms on all of these facilities to be competitive with our public franchise dealer operator peers.

Richard Aldahan, LMP’s Chief Operating Officer added, “There is a ton of opportunity for us to partner with dealers and consolidate the market. In the recent months, the company has signed definitive agreements to partner and purchase dealerships. These facilities can enable LMP to begin a rolling close process.”

“LMP is laser focused on the execution of its e-commerce hybrid online strategy. This prospective partnership represents meaningful progress towards our 2021 plan. As we begin to overlay our model on top of our acquired dealerships, we expect momentum to accelerate and the Company looks forward to achieving many more significant and transformative milestones in the future,” Mr. Aldahan concluded.

ABOUT LMP AUTOMOTIVE HOLDINGS, INC. – “BUY, SUBSCRIBE, SELL AND REPEAT.”

LMP Automotive Holdings, Inc. (NASDAQ: LMPX) describes its business model as “Buy, Subscribe, Sell and Repeat.” This means that we “Buy” pre-owned automobiles primarily through auctions or directly from other automobile dealers, and new automobiles from manufacturers and manufacturer distributors. We “Subscribe” the automobiles to our customers by allowing them to enter into our subscription plan for automobiles in which customers have use of an automobile for a minimum of thirty (30) days. LMP’s vehicle subscription membership includes monthly swaps and offers the flexibility to return the vehicle without penalty, upgrade your vehicle to a more premium model or downgrade for a lesser cost model when you like. We “Sell” our inventory, including automobiles previously included in our subscription programs, to customers as well, and then we “Repeat” the whole process.

Investor Relations
:

LMP Automotive Holdings, Inc.
500 East Broward Boulevard, Suite 1900
Fort Lauderdale, FL 33394
[email protected]

For more information visit: https://lmpmotors.com/.

FORWARD-LOOKING STATEMENTS:
This press release may contain “forward-looking statements” within the meaning of Section 27A of the Securities Act of 1933 and Section 21E of the Securities Exchange Act of 1934, each as amended. Such statements include, but are not limited to, any statements relating to our expectations, beliefs, projections, future plans and strategies, anticipated events or trends and similar matters that are not historical facts. These statements may be preceded by, followed by or include the words “aim,” “anticipate,” “believe,” “estimate,” “expect,” “forecast,” “intend,” “likely,” “outlook,” “plan,” “potential,” “project,” “projection,” “seek,” “can,” “could,” “may,” “should,” “would,” will,” the negatives thereof and other words and terms of similar meanings. Forward-looking statements are based on management’s current expectations and are subject to risks and uncertainties that could negatively affect our business, operating results, financial condition and stock value. Factors that could cause actual results to differ materially from those currently anticipated include: our dependence upon external sources for the financing of our operations; our ability to effectively execute our business plan; our ability to maintain and grow our reputation and to achieve and maintain the market acceptance of our services and platform; our ability to manage the growth of our operations over time; our ability to maintain adequate protection of our intellectual property and to avoid violation of the intellectual property rights of others; our ability to maintain relationships with existing customers and automobile suppliers, and develop relationships; and our ability to compete and succeed in a highly competitive and evolving industry; as well as other risks described in our SEC filings. There is no assurance that any forward-looking statements will materialize. You are cautioned not to place undue reliance on forward-looking statements, which reflect expectations only as of this date. We expressly disclaim any obligation or undertaking to release publicly any updates or revisions to any forward-looking statements contained herein to reflect any change in our expectations or any changes in events, conditions or circumstances on which any such statement is based, except as required by law.

SOURCE: LMP Automotive Holdings, Inc.


Notice of Redemption

Notice of Redemption

HSBC Holdings plc

(the ‘Issuer’)

1,450,000 6.20% Non-Cumulative Dollar Preference Shares, Series A

(the ‘Preference Shares’)

represented by American Depositary Shares, Series A (the ‘ADSs’)

LONDON–(BUSINESS WIRE)–
HSBC Holdings plc has given notice of redemption and cancellation (the ‘Redemption Notice’) to The Bank of New York Mellon (formerly, The Bank of New York) (the ‘Depositary’), as the holder of the Issuer’s Preference Shares represented by the ADSs (ADS CUSIP: 404280604; ADS ISIN: US4042806046).

The ADSs were issued pursuant to the Deposit Agreement, dated 6 December 2002, among the Issuer, the Depositary, and all Holders and Beneficial Owners from time to time of the Receipts issued thereunder (the ‘Deposit Agreement’). Capitalised terms used herein and not defined herein shall have the respective meanings ascribed to such terms in the Deposit Agreement.

Further to a resolution of the Board of Directors of the Issuer (the ‘Board’) at a meeting held on 13 February 2020 (the ‘Board Resolutions’), and pursuant to the terms of the Preference Shares, the Articles of Association of the Issuer (the ‘Articles’) and the Deposit Agreement, the Issuer has notified the Depositary that:


(i)

all the outstanding Preference Shares shall be redeemed in accordance with the terms of the Preference Shares, the Articles, the Board Resolutions and the UK Companies Act 2006 on 13 January 2021 (the ‘Redemption Date’) at a redemption price per Preference Share equal to US$1,000 plus accrued and unpaid dividends for the then-current dividend period, beginning on (and including) 15 December 2020, to (but excluding) the Redemption Date (the ‘Redemption Price’);


(ii)

share warrants, other documents of title, share certificates or such other evidence as may be accepted by the Board in respect of the Preference Shares are to be presented and surrendered for redemption at the Issuer’s Secretary’s Office located at 8 Canada Square, London E14 5HQ, United Kingdom on the Redemption Date;


(iii)

all dividends on the Preference Shares shall cease to accrue as from the Redemption Date; and


(iv)

upon redemption of the Preference Shares on the Redemption Date, the Preference Shares shall appear as redeemed on the share register of the Issuer and shall be treated as cancelled.

No defect in the Redemption Notice or in the giving of notice will affect the validity of the redemption proceedings. The quarterly dividends payable on the Preference Shares on 15 December 2020 will be unaffected by the Redemption Notice and the redemption of the Preference Shares.

Pursuant to Section 2.11 of the Deposit Agreement, upon receipt of the Redemption Notice, the Issuer has requested that the Depositary send to the Holders and Beneficial Owners a notice calling for the surrender of the Receipts that evidence the ADSs representing the Preference Shares that the Issuer has called for redemption. On the Redemption Date, the Depositary will redeem the number of ADSs corresponding to the Preference Shares being redeemed at a price per ADS equal to US$25 plus US$0.124861 in accrued and unpaid dividends for the then-current dividend period, beginning on (and including) 15 December 2020, to (but excluding) the Redemption Date (the ‘ADS Redemption Price’).

Payments in respect of the amount due on redemption of the Preference Shares by the Issuer shall be made to the Depositary by transfer to the Depositary’s bank account, in same-day funds.

By 12:00 noon, London time, on the Redemption Date, the Issuer will irrevocably deposit with the Depositary the Redemption Price for the Preference Shares, being an amount sufficient to pay the ADS Redemption Price for the ADSs, and will also give the Depositary irrevocable instructions and authority to pay the ADS Redemption Price to the holders of the ADSs, and the Depositary shall cancel surrendered Receipts evidencing the corresponding number of ADSs and distribute the ADS Redemption Price to the Holders entitled to it in accordance with applicable provisions of the Deposit Agreement.

The receipt by the Depositary of the monies payable on redemption of the Preference Shares shall constitute an absolute discharge of the Issuer’s obligations in respect of the Preference Shares, the ADSs and the Receipts.

Note to editors:

HSBC Holdings plc

HSBC Holdings plc, the parent company of the HSBC Group, is headquartered in London. HSBC serves customers worldwide from offices in 64 countries and territories in our geographical regions: Europe, Asia, North America, Latin America, and Middle East and North Africa. With assets of US$2,956bn at 30 September 2020, HSBC is one of the world’s largest banking and financial services organisations.

Investor enquiries to:

Greg Case

+44 (0) 20 7992 3825

[email protected]

Media enquiries to:

Gillian James

+44 (0) 20 7992 0516

[email protected]

KEYWORDS: United Kingdom Europe

INDUSTRY KEYWORDS: Banking Professional Services Finance

MEDIA:

Logo
Logo

CBRE Clarion Global Real Estate Income Fund (NYSE: IGR) Declares Monthly Distribution for December

CBRE Clarion Global Real Estate Income Fund (NYSE: IGR) Declares Monthly Distribution for December

PHILADELPHIA–(BUSINESS WIRE)–
The Board of Trustees of the CBRE Clarion Global Real Estate Income Fund (NYSE: IGR) (the “Fund”) has declared a monthly distribution of $0.05 per share for the month of December 2020. The following dates apply:


Declaration Date


Ex-Dividend Date


Record Date


Payable Date

December 2020


12-01-2020


12-18-2020


12-21-2020


12-31-2020

IGR’s current annualized distribution rate is 8.9% based on the closing market price of $6.75 on December 8, 2020, and 7.6% based on a closing NAV of $7.92 as of the same date.

Future earnings of the Fund cannot be guaranteed, and the Fund’s distribution policy is subject to change. For more information on the Fund, please visit www.cbreclarion.com.

The Fund’s monthly distribution is set by its Board of Trustees. The Board reviews the Fund’s distribution on a quarterly basis in view of its net investment income, realized and unrealized gains, and other net unrealized appreciation or income expected during the remainder of the year. The Fund strives to establish a level monthly distribution that, over the course of the year, will serve to distribute an amount closely approximating the Fund’s net investment income and net realized capital gains during the year.

CBRE Clarion Global Real Estate Income Fund is a closed-end fund, which is traded on the New York Stock Exchange and invests primarily in real estate securities. Holdings are subject to change. Past performance is no guarantee of future results.

For the current fiscal year (January 1, 2020 to December 31, 2020), the Fund has made or declared twelve (12) regular monthly distributions totaling $0.60 per share. The source of the distribution declared for the current month and fiscal year to date is estimated as follows:

Estimated Source of Distributions:


Estimated Allocations

Distribution


Net Investment

Income


Net Realized Short-

Term Capital Gains


Net Realized Long-

Term Capital Gains


Return of

Capital

Current


$0.05


$0.015 (31%)


— (0%)


— (0%)


$0.035 (69%)

YTD


$0.60


$0.183 (31%)


— (0%)


— (0%)


$0.417 (69%)

The allocations reported in this notice are only estimates and are not provided for tax reporting purposes. The actual allocations will depend on the Fund’s investment experience during the remainder of its fiscal year and will not be finalized until after year-end. In addition, the allocations reported to shareholders for tax reporting purposes will also reflect adjustments required under applicable tax regulations. Some of these tax adjustments are significant, and amounts reported to you for tax reporting may be substantially different than those presented in this notice. SHAREHOLDERS WILL BE SENT A FORM 1099-DIV FOR THE CALENDAR YEAR INDICATING HOW TO REPORT FUND DISTRIBUTIONS FOR FEDERAL INCOME TAX PURPOSES.

The estimated allocations presented above are based on the Fund’s monthly calculation of its year-to-date net investment income, capital gains and returns of capital. The Fund’s investment income is mainly comprised of distributions received from the real estate investment trusts (REITs) and other companies in which it invests. “Net investment income” refers to the Fund’s investment income offset by its expenditures, which include the fees paid to the investment adviser and other service providers. “Net realized capital gains” represents the aggregation of the capital gains and losses realized by the Fund from its purchase and sale of investment securities during the year-to-date period. Short-term capital gains are those arising from the sale of securities held by the Fund for less than one year. Long-term capital gains are those arising from the sale of securities held by the Fund for a year or more. The amount of net realized capital gains is also offset by capital losses realized in prior years. Adjustments to net investment income are made based on the character of distributions received by the Fund. A portion of the distributions the Fund receives from REITs will be characterized by the REITs as capital gains or returns of capital. Because REITs often reclassify the distributions they make, the Fund does not know the ultimate character of these distributions at the time they are received, so the Fund estimates the character based on historical information. The Fund’s net investment income is reduced by the amounts characterized by the REITs as capital gains and returns of capital. Amounts characterized by the REITs as capital gains are added to the Fund’s net realized capital gains. Amounts characterized by the REITs as return of capital are classified as such by the Fund.

The Fund estimates that it has distributed more than its net investment income and net realized capital gains; therefore, a portion of your distribution may be a return of capital. A return of capital may occur, for example, when some or all of the money that you invested in the Fund is paid back to you. A return of capital distribution does not necessarily reflect the Fund’s investment performance and should not be confused with “yield” or “income”.

Shareholders should not draw any conclusions about the Fund’s investment performance from the amount of this distribution or from the terms of the Fund’s managed distribution policy. The performance and distribution rate information disclosed in the table below is based on the Fund’s net asset value (“NAV”). The Fund’s NAV is calculated as the total market value of all the securities and other assets held by the Fund minus the total value of its liabilities. Performance figures are not meant to represent individual shareholder performance. The value of a shareholder’s investment in the Fund is determined by the market price of the Fund’s shares.

The Fund’s Cumulative Total Return for fiscal year to date 2020 (January 1, 2020 through November 30, 2020) is set forth below. Shareholders should take note of the relationship between the Cumulative Total Return and the Fund’s Cumulative Distribution Rate for 2020, as well as its Current Annualized Distribution Rate. Moreover, the Fund’s Average Annual Total Return for the preceding five-year period (December 1, 2015 through November 30, 2020) is set forth below. Shareholders should take note of the relationship between the Fund’s Average Annual Total Return and its Average Annual Distribution Rate for the preceding five-year period.

Fund Performance and Distribution Rate Information:

Year-to-date 01/01/2020 to 11/30/2020


Cumulative Total Return1


-5.00

%

Cumulative Distribution Rate2


7.05

%

Preceding Five-Year Period 12/01/2015 to 11/30/2020


Average Annual Total Return3


4.53

%

Average Annual Distribution Rate4


7.10

%

Current Annualized Distribution Rate5


7.69

%

  1. Cumulative Total Return is the percentage change in the Fund’s NAV over the year-to-date time period including distributions paid and assuming reinvestment of those distributions.
  2. Cumulative Distribution Rate for fiscal year to date 2020 (January 1, 2020 through November 30, 2020) is determined by dividing the dollar value of distributions in the period by the Fund’s NAV as of November 30, 2020.
  3. Average Annual Total Return represents the simple arithmetic average of the Annual Total Returns of the Fund for the preceding five-year period. Annual Total Return is the percentage change in the Fund’s NAV over a year including distributions paid and assuming reinvestment of those distributions.
  4. Average Annual Distribution Rate is the simple arithmetic average of the Annual Distribution Rates for the preceding five-year period. The Annual Distribution Rates are calculated by taking the total distributions paid during the period divided by average daily NAV for the period.
  5. The Current Annualized Distribution Rate is the current monthly distribution rate annualized as a percentage of the Fund’s NAV as of November 30, 2020.

Please refer to the chart below for information about the Fund’s historical NAVs, change in NAVs, total returns, and distributions paid.


Average

Daily

NAV for

Period


End of

Period

NAV Per

Share


Change

in

NAV


Annualized

Total

Returns


Distribution

Rate4


Level

Distributions

Paid


Special

Distributions

Paid


Total

Distributions

Paid

IPO


$

15.00


20041


$

14.39


$

17.46


16.40

%


28.20

%


5.77

%


$

0.75


$

0.08


$

0.83

2005


$

16.81


$

17.23


-1.32

%


8.13

%


8.75

%


$

1.29


$

0.18


$

1.47

2006


$

20.27


$

22.78


32.21

%


53.42

%


16.13

%


$

1.38


$

1.89


$

3.27

2007


$

21.67


$

16.16


-29.06

%


-15.82

%


14.86

%


$

1.38


$

1.84


$

3.22

2008


$

11.97


$

5.63


-65.16

%


-61.14

%


10.36

%


$

1.24


$


$

1.24

2009


$

5.82


$

7.51


33.39

%


46.79

%


9.28

%


$

0.54


$


$

0.54

2010


$

7.82


$

8.58


14.25

%


22.41

%


6.91

%


$

0.54


$


$

0.54

2011


$

8.60


$

8.14


-5.13

%


0.94

%


6.28

%


$

0.54


$


$

0.54

2012


$

8.99


$

9.48


16.46

%


24.15

%


6.47

%


$

0.54


$

0.042


$

0.582

2013


$

9.57


$

9.04


-4.64

%


0.91

%


5.64

%


$

0.54


$


$

0.54

2014


$

9.77


$

10.16


12.39

%


18.73

%


5.52

%


$

0.54


$


$

0.54

2015


$

9.67


$

9.04


-11.02

%


-5.57

%


5.89

%


$

0.57


$


$

0.57

2016


$

9.11


$

8.65


-4.31

%


2.17

%


6.58

%


$

0.60


$


$

0.60

2017


$

8.75


$

8.99


3.93

%


11.29

%


6.85

%


$

0.60


$


$

0.60

2018


$

8.36


$

7.55


-16.02

%


-9.75

%


7.18

%


$

0.60


$


$

0.60

2019


$

8.62


$

8.86


17.35

%


25.79

%


6.96

%


$

0.60


$


$

0.60

20202


$

7.47


$

7.80


-11.96

%


-5.00

%


7.37

%


$

0.55


$


$

0.55

Average3


8.69

%


8.16

%


Since Inception Annualized Total Return 4.74%

  1. Figures for 2004 are from February 24, 2004, the Fund’s inception date.
  2. 2020 figures are for year to date through November 30, 2020.
  3. Average calculated on number of months and years since inception. The Fund’s inception date was February 24, 2004.
  4. Distribution rate calculated by taking the total distributions paid within the period divided by average daily NAV for the period.

Sources: NAV per share amounts and annualized total returns are published in the Fund’s audited annual reports for the respective year.

About CBRE Clarion Securities:

CBRE Clarion Securities is a registered investment advisory firm specializing in the management of global real asset securities for institutional investors. Headquartered near Philadelphia, the firm has personnel located in the United States, United Kingdom, Hong Kong, Japan, and Australia. For more information about CBRE Clarion Securities, please visit www.cbreclarion.com.

CBRE Clarion Securities is the listed equity management arm of CBRE Global Investors. CBRE Global Investors is a global real assets investment management firm with $114.5 billion in assets under management* as of September 30, 2020. The firm sponsors investment programs across the risk/return spectrum for investors worldwide.

CBRE Global Investors is an independently operated affiliate of CBRE Group, Inc. (NYSE:CBRE). It harnesses the research, investment sourcing and other resources of the world’s largest commercial real estate services and investment firm (based on 2019 revenue) for the benefit of its investors. CBRE Group, Inc. has more than 100,000 employees (excluding affiliates) and serves real estate investors and occupiers through more than 530 offices (excluding affiliates) worldwide. For more information about CBRE Global Investors, please visit www.cbreglobalinvestors.com

*Assets under management (AUM) refers to the fair market value of real assets-related investments with respect to which CBRE Global Investors provides, on a global basis, oversight, investment management services and other advice and which generally consist of investments in real assets; equity in funds and joint ventures; securities portfolios; operating companies and real assets-related loans. This AUM is intended principally to reflect the extent of CBRE Global Investors’ presence in the global real assets market, and its calculation of AUM may differ from the calculations of other asset managers.

Analyst and Press Inquiries:

David Leggette, Principal

610.995.2500

Investor Relations:

888.711.4272

www.cbreclarion.com

KEYWORDS: United States North America Pennsylvania

INDUSTRY KEYWORDS: REIT Finance Banking Professional Services Construction & Property

MEDIA: