Roxgold Reports Fourth Quarter and Full Year 2020 Results
TORONTO–(BUSINESS WIRE)–
Roxgold Inc. (“Roxgold” or the “Company”) (TSX: ROXG) (OTCQX: ROGFF) today reported its fourth quarter and full year financial results for the period ended December 31, 2020.
This press release features multimedia. View the full release here: https://www.businesswire.com/news/home/20210303006002/en/
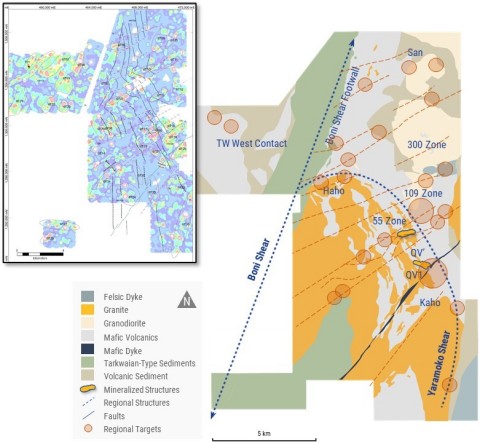
Figure 1. Yaramoko regional prospects (Graphic: Business Wire)
For complete details of the audited Consolidated Financial Statements and associated Management’s Discussion and Analysis please refer to the Company’s filings on SEDAR (www.sedar.com) or the Company’s website (www.roxgold.com). All amounts are in U.S. dollars unless otherwise indicated.
Full Year 2020 Highlights:
During the year ended December 31, 2020, the Company:
Operations
-
Produced 133,940 ounces of gold at an average grade of 8.49 grams per tonne in 2020 – exceeding the upper end of annual gold production guidance of 130,000 ounces.
-
Achieved cash operating costs of $579 per ounce within the annual cost guidance range of $520 to $580 per ounce.
-
Processed a record annual throughput of 512,276 tonnes exceeding nameplate capacity by 27%.
-
Reported an interim Mineral Reserves and Resources estimate at Yaramoko with total Proven and Probable Mineral Reserves increasing by 8% to 710,000 ounces of gold more than replacing depletion of 207,396 ounces during the period from December 31, 2018 to June 30, 2020. Measured and Indicated Mineral Resources increased 4% to 857,000 ounces of gold.
Financial
-
Sold 135,310 ounces of gold for a total of $239.7 million in gold sales in 2020 (140,800 ounces1 and $196.2 million1 respectively in 2019).
-
Achieved adjusted EBITDA2 of $108.8 million in 2020 compared to $83.3 million in 2019.
-
Generated cash flow from mining operations2 totalling $126.2 million for cash flow from mining operations per share2 of $0.34 (C$0.45/share).
-
Strong free cashflow (before growth spend)3 of $47.8 million increasing the cash balance by $20.1 million to $61.9 million.
-
Strengthened the balance sheet ending the year with a cash balance of $61.9 million and net cash position of $27.3 million.
-
Adjusted net income2 of $38.8 million or $0.10 per share (C$0.14/share); compared to $19.5 million or $0.05 per share (C$0.07/share) in 2019.
-
Produced a mine operating margin2 of $1,079 per ounce in 2020.
-
Generated a strong return on equity2 of 20% in 2020.
Growth
-
Received Exploitation (mining) permit and Environmental approvals from the government of Côte d’Ivoire to develop and operate the Séguéla Gold Project.
-
Expanded Séguéla Gold Project with discovery of the Koula deposit and an updated Mineral Resource estimate outlining total indicated mineral resources of 1,044,000 ounces of gold at 2.5 grams per tonne (“g/t”) and inferred mineral resources of 370,000 ounces at 4.8 g/t.
-
Commenced an infill drilling program at Koula with initial results such as 14m at 42.9 g/t from 61 metres down-hole in SGRD1000, 11m at 46.2 g/t Au from 48 metres down-hole in SGRC799, and 18m at 22.1 g/t Au from 175 metres down-hole in SGRD800, continue to emphasise the high grade nature of the deposit.
-
Commenced early works at Séguéla to enable a rapid ramp up to full construction in 2021 following completion of the Feasibility Study which is anticipated for completion in the second quarter of 2021.
-
Repurchased a 0.3% Net Smelter Royalty on Séguéla from an original property owner, exercising the right of first refusal to pre-empt an arms-length acquisition between the property owner and an international royalty company for consideration of $0.7 million cash. Séguéla continues to have a 1.2% NSR held by another original property owner under similar terms including a right of first refusal and a right to acquire the remaining royalty for fair market value after a decision to mine has been made.
-
Tested additional mineralization corridors at Boussoura which targeted the vein corridors to the west of Fofora Main including a new VC2 prospect with results such as 14m at 3.6g/t Au from 44m in BSR-20-RC-FFR-134, 5m at 17.0 g/t Au from 59m in BSR20-RC-FFR142 and 23m at 2.0g/t Au from 41m in BSR-20-RC-FFR-143.
Safety
-
Maintained an industry-leading Lost Time Injury Frequency Rate (LTIFR) per 1,000,000hrs of 0.37 for 2.69 million man-hours, including one lost time incident for the 12-month period. This was the first LTI incident at Yaramoko since September 2018.
-
Continued management of the current global COVID-19 crisis with operations at Yaramoko not materially impacted with heightened preventative measures and response plans in place to mitigate and minimize any potential impacts. Operations continue to operate with reduced personnel due to COVID-19 travel restrictions and protection protocols. The Company is continually assessing the health and safety risks to the Company’s personnel and contractors at its operations and offices.
“Looking back on 2020, Roxgold was able to rise to the challenge of global events by delivering remarkably strong operating and financial results while advancing the near-term growth potential of the company and ensuring the safety and security of our teams and the communities in which we operate,” commented John Dorward, President and CEO of Roxgold. “Roxgold is well on the road towards becoming the West Africa’s next multi-asset gold producer. The Séguéla Gold Project in Côte d’Ivoire is expected to start construction this year, which has the potential to more than double our production, reserve base, cash flows, and earnings – whilst giving Roxgold further diversification to meet the growing appetite of the investment community.
“The Yaramoko Gold Complex once again delivered strong operating results in 2020, with gold production of 133,940 ounces at cash operating costs of $579 per ounce, exceeding our annual production guidance for the year. Yaramoko continues to be the cashflow engine for this company, as we generated cash flow from mining operations of $126.2 million, achieved adjusted net income of $38.8 million, and reported a return on equity of 20% enabling us to strengthen our balance sheet to end the year with a cash balance of $61.9 million. Since starting production in 2016, Yaramoko has produced over 610,000 ounces of gold and, as the recent resource update highlighted, continues to demonstrate its ability to replace production and maintain a long mine life.
“Our strong balance sheet has enabled us to continue to invest in our growth projects with significant advancement at Séguéla delivered through the hard work of our exploration and project teams, growing in scale with the discovery of the high-grade Koula deposit and an updated Mineral Resource estimate outlining total indicated mineral resources of 1,044,000 ounces of gold at 2.5 grams per tonne (“g/t”) and inferred mineral resources of 370,000 ounces at 4.8 g/t. This project was acquired for just $20 million in 2019 and we are eager to share with the market the results of the upcoming Feasibility Study in the second quarter, which we believe will make material improvements upon the already robust Preliminary Economic Assessment announced in April 2020 with an after-tax NPV of $344 million and 81% IRR at $1,650/oz gold. Finally, during the year we also announced a new high-grade discovery at the Boussoura Project in the southern portion of the Houndé Greenstone Belt in southern Burkina Faso. Since then, we have drilled over 150 holes at Boussoura with consistent assay returns demonstrating broad intersections of mineralization.”
2020 Quarterly & Annual Highlights
|
|
Three months
ended
December 31
2020
|
Three months
ended
December 31
2019
|
Year ended
December 31
2020
|
Year ended
December 31
2019
|
|
|
|
|
|
|
|
Gold ounces produced
|
35,191
|
41,162
|
133,940
|
142,204
|
|
Gold ounces sold1
|
38,504
|
40,700
|
135,310
|
140,800
|
|
|
|
|
|
|
|
Financial Data (in thousands of U.S. dollars)
|
|
|
|
|
|
Gold sales1
|
72,155
|
60,208
|
239,686
|
196,151
|
|
Mine operating profit4
|
27,955
|
20,423
|
88,381
|
60,920
|
|
EBITDA2
|
31,224
|
24,743
|
94,857
|
69,410
|
|
Adjusted EBITDA2
|
34,333
|
26,993
|
108,760
|
83,262
|
|
Adjusted EBITDA margin2
|
48%
|
45%
|
45%
|
43%
|
|
Net income
|
9,917
|
4,761
|
24,901
|
5,663
|
|
Basic earnings per share attr. to shareholders
|
0.02
|
0.01
|
0.05
|
0.01
|
|
Adjusted net income2
|
13,205
|
7,011
|
38,804
|
19,515
|
|
Per share2
|
0.04
|
0.02
|
0.10
|
0.05
|
|
Cash flow from mining operations2
|
39,261
|
30,660
|
126,151
|
98,339
|
|
Per share2
|
0.11
|
0.08
|
0.34
|
0.27
|
|
Return on equity2
|
20%
|
11%
|
20%
|
11%
|
|
Cash on hand end of period
|
61,878
|
41,780
|
61,878
|
41,780
|
|
Total assets
|
343,547
|
291,683
|
343,547
|
291,683
|
|
|
|
|
|
|
|
Statistics (in dollars)
|
|
|
|
|
|
Average realized selling price (per ounce)
|
1,874
|
1,479
|
1,771
|
1,393
|
|
Cash operating cost (per tonne processed)2
|
152
|
146
|
152
|
149
|
|
Cash operating cost (per ounce produced)2
|
553
|
466
|
579
|
489
|
|
Total cash cost (per ounce sold)2
|
682
|
576
|
692
|
568
|
|
Sustaining capital cost (per ounce sold)2
|
180
|
269
|
262
|
216
|
|
Site all-in sustaining cost (per ounce sold)2
|
862
|
845
|
954
|
784
|
|
All-in sustaining cost (per ounce sold)2
|
908
|
914
|
1,004
|
844
|
2020 In Review
Production
At Yaramoko, we continued to see strong operating performance and cashflow generation. Yaramoko produced 133,940 ounces of gold exceeding the upper end of guidance of 130,000 ounces and processed a record 512,276 tonnes at an average head grade of 8.5 g/t and mill recoveries of 98.1%.
Cash operating & All-in sustaining costs
Cash operating cost2 of $579 was within the guidance range of $520 to $580 per ounce. All-in sustaining cost2 of $1,004 was slightly above guidance range of $930 to $990 per ounce sold primarily due to the following reasons:
-
Reduced mining activities at Yaramoko as it continued to operate with reduced personnel due to COVID-19 travel restrictions and protection protocols. Throughput levels were maintained as the processing plant was supplemented with 84,911 tonnes of low-grade stockpile at an average grade of 2.89 g/t processed. The cash cost impact of processing the lower grade stockpiled material was $35 per ounce sold.
-
The higher average realised gold price of $1,771 per ounce also increased royalty payments by $19 per ounce sold compare to guidance assumptions.
Total mine operating expense for the year ended December 31, 2020 include $3.0 million for COVID-19 costs, which reflects incremental costs, primarily related to personnel, camp and transportation costs. These costs are excluded from per ounce cost metrics.
We continued to strengthen our balance sheet ending the year with approximately $61.9 million in cash and in a net cash position of $27.3 million. The company also has an additional US$20 million as a revolving credit facility that remains unutilized at the end of the year.
Growth
The Company has had an exceptional year in progressing the Séguéla Gold Project, extending the mine life at Yaramoko and the discovery of Boussoura.
Séguéla Gold Project
-
Received Exploitation (mining) permit and Environmental approvals from the government of Côte d’Ivoire to develop and operate the Séguéla Gold Project in Q4 2020
-
Expanded Séguéla Gold Project with discovery of the Koula deposit and an updated Mineral Resource estimate outlining total indicated mineral resources of 1,044,000 ounces of gold at 2.5 grams per tonne (“g/t”) and inferred mineral resources of 370,000 ounces at 4.8 g/t
-
Commenced infill drilling program at Koula with initial results such as 14m at 42.9 g/t from 61 metres down-hole in SGRD1000, 11m at 46.2 g/t Au from 48 metres down-hole in SGRC799, and 18m at 22.1 g/t Au from 175 metres down-hole in SGRD800, continue to emphasise the high grade nature of the deposit
-
Commenced early works at Séguéla to enable a rapid ramp up to full construction in 2021 following completion of the Feasibility Study which is anticipated for completion in the second quarter of 2021
-
Repurchased a 0.3% Net Smelter Royalty on Séguéla from an original property owner, exercising the right of first refusal to pre-empt an arms-length acquisition between the original property owner and an international royalty company for consideration of $0.7 million cash. Séguéla continues to have a 1.2% NSR held by another original property owner under similar terms including a right of first refusal and a right to acquire the remaining royalty for fair market value after a decision to mine has been made.
Yaramoko Mine Complex
Reported an interim Reserves and Resources estimate at Yaramoko with total Proven and Probable Mineral Reserves increasing by 8% to 710,000 ounces of gold replacing depletion of 207,396 ounces during the period from December 31, 2018 to June 30, 2020. Measured and Indicated Mineral Resources increased 4% to 857,000 ounces of gold increasing the mineral endowment of Measured and Indicated Mineral Resources plus cumulative production to date at Yaramoko to 1.5 million ounces.
Boussoura
On February 3, 2020, the Company announced a new high-grade discovery at Galgouli, and excellent results following up historic drilling at Fofora at the Boussoura Project in the southern portion of the Houndé Greenstone Belt in southern Burkina Faso. During the year, over 150 holes have been drilled with consistent assay returns demonstrating broad intersections of mineralization with lower grade halos surrounding higher grade quartz veins – characteristic of the style of mineralization found within the prolific Houndé Gold Belt.
2021 Production and Cost Guidance
-
Gold production between 120,000 and 130,000 ounces
-
Cash operating cost2 between $580 and $640/ounce
-
All-in sustaining cost2 between $895 and $975/ounce
-
Sustaining capital spend between $25 to $30 million
-
Non-sustaining capital spend of $5-$10 million
-
Growth spend (includes Exploration and Séguéla study spend) of $15-$20 million
Roxgold anticipates the Yaramoko Mine Complex will produce between 120,000 and 130,000 ounces in 2021 with cash operating costs of $580–640/oz and all-in sustaining costs (“AISC”) of $895–975/oz. Sustaining capital is expected to decline this year compared to 2020 due to the completion of decline development at Bagassi South, allowing the operation to focus on stoping operations. The higher gold price increased the impact of royalties by approximately $30/oz.
The production and cost guidance assumes no material operational impacts due to COVID-19. A prolonged COVID-19 related delay or significant deterioration in operating conditions may have an impact on production and cost guidance.
Response to the COVID-19 Pandemic
Management of the current global COVID-19 crisis is ongoing particularly as various jurisdictions implement measures to re-open or close again, their economies. The Company has been proactive in its response to the potential threats posed by COVID-19 and has implemented a range of measures to protect the health and well-being of its employees and host communities while continuing to operate to the extent possible, in ordinary course of business. These measures include, but not limited to, quarantine, reducing on-site crew sizes, enhanced cleaning and disinfecting protocols, requiring workers with symptoms to self isolate and promoting preventative measures including social distancing and frequent handwashing. All employees returning to site are required to complete a testing and screening process. As a result, operations at Yaramoko to date have not been materially impacted by COVID-19. The Company is continually assessing the evolving situation, including the health and safety risks to the Company’s personnel and contractors at its operations and offices.
Whilst production at Yaramoko has been maintained, if a prolonged COVID-19 related interruption were to occur it may have an impact on the Company’s operations, financial position and liquidity. The Company has strengthened its liquidity position in the quarter with its cash increasing to $61.9 million and unutilised revolving credit facility totalling $20 million.
Review of Annual 2020 Financial Results
Mine operating profit
During the year ended December 31, 2020, revenues totalled $239.7 million (2019 – $182.0 million) while mine operating expenses and royalties totalled $81.9 million (2019 – $59.9 million) and $14.4 million (2019 – $10.0 million), respectively. The increase in sales is primarily due to a 27% increase in the average realized gold price, offset by an 4% decrease in ounces sold. Total mine operating expenses included $3.0 million COVID-19 related costs reflecting incremental costs, primarily relating to personnel, camp and transportation costs. During the year, the Company achieved total cash cost2 per ounce sold of $692 and a mine operating margin2 of $1,079 per ounce sold.
For more information on the cash operating costs2 see the financial performance of the Mine Operating Activities section of the Company’s Management’s Discussion and Analysis (“MD&A”) that is available on the Company’s website at www.roxgold.com and on SEDAR at www.sedar.com.
During 2020, mine operating expenses totalled $81.9 million compared to $59.9 million in 2019. Mine operating expenses increased in 2020 as Bagassi South achieved commercial production in September 2019. In 2019, pre-commercial mine operating expenses of $9.4 million were capitalized to property, plant and equipment.
During 2020, depreciation totalled $55.0 million compared to $51.1 million in 2019. The increase in depreciation is a result of the continued investment in the underground development of 55 Zone and Bagassi South combined with higher throughput.
General and administrative expenses
General and administrative expenses for 2020 were $5.6 million compared to $5.4 million in 2019.
Sustainability and other in-country costs
Sustainability and in-country costs totalled $1.6 million for the year ended December 31, 2020, respectively compared to $3.0 million in the comparative period. The decrease in expenditures primarily relates to timing of community investments in 2020 which were impacted by COVID-19. These expenditures are incurred as part of Roxgold’s commitment to responsible operations in Burkina Faso including several sustainability and community projects.
Exploration and evaluation expenses (“E&E”)
Exploration and evaluation expenses totalled $29.6 million in 2020 compared to $16.1 million in 2019. The significant increase in exploration and evaluation activities was primarily due to the advancement of the feasibility study at the Séguéla Gold Project expected to be released in the second quarter of 2021. There was also drilling at the Boussoura project in Burkina Faso.
E&E expenses totalled $21.4 million at the Séguéla Gold Project and $8.9 million for Boussoura and Yaramoko in 2020. Expenditures at the Séguéla Gold Project included $15.0 million in drilling costs, and $3.5 million on the PEA study and feasibility study costs. Drilling expenses totalled $2.9 million at the Boussoura project for the current year.
Share-based payments
Share-based payments totalled $3.5 million for the year ended December 31, 2020 compared to $2.5 million in 2019. The increase is mainly due to an increase in the Company’s share price.
Other income (expenses)
Other income (expenses) totalled $11.1 million in 2020, respectively compared to $18.7 million in the comparative period. The decrease is mainly attributed to the favourable movement in foreign exchange gain of $2.6 million in 2020 compared to a foreign exchange loss of $2.0 million in 2019.
Current and deferred income tax expense
The current income tax expense for year ended December 31, 2020 has increased to 2019 due to higher mine operating profits. The higher effective tax rate is also driven by the significant increase in exploration expenditures in 2020 incurred in Burkina Faso and Côte d’Ivoire not being tax effected due to the Company’s status under the mining regulations.
Net income & EBITDA
The Company’s net income was $24.9 million in 2020 and compared to net income of $5.7 million in 2019. The Company’s EBITDA2 was $94.9 million for the year ended December 31, 2020 compared to $69.4 million in 2019.
Net income increased significantly compared to 2019 primarily as a result of higher average realized gold sales price, offset by its focus on growth with significant investments in exploration and evaluation at Séguéla and Boussoura and higher depreciation.
Income Attributable to Non-Controlling Interest
For the year ended December 31, 2020, the income attributable to the non-controlling (“NCI”) interest was $6.0 million. The Government of Burkina Faso holds a 10% carried interest in Roxgold SANU SA and as such is considered Roxgold’s NCI. The NCI attributable income is based on IFRS accounting principles and does not reflect dividend payable to the minority shareholder of the operating legal entity in Burkina Faso.
Financial Position
At December 31, 2020, the Company had $61.9 million in cash and cash equivalents, with $34.6 million of long-term debt. The restricted cash totalling $2.1 million relates to funds restricted for the purposes of future restoration costs of the Yaramoko Gold Mine. The Company’s current assets exceeds its current liabilities by $32.1 million.
With the existing cash balance and the forecasted cash flows from operations, the Company is well positioned to fund its cash requirements for the next twelve months which relate primarily to the following activities:
-
Underground development at the 55 Zone and Bagassi South
-
Exploration programs at Séguéla and Boussoura
-
Principal debt and interest repayments
-
The potential commencement of construction at Séguéla pending the outcome of the feasibility study
The Company manages its capital structure and adjusts when necessary in accordance with its objectives and changes in economic conditions. During Q2 2020, the Company completed the refinancing of its existing credit facility by consolidating the outstanding principal amount of the original credit facility as well as the revolving credit facility into a single credit facility with an outstanding principal balance of $35.6 million as at December 31, 2020.
The Company’s total assets as at December 31, 2020 has increased by $51.9 million when compared to December 31, 2019. This is mainly driven by the increase in cash, and continuing investment in property, plant and equipment and increase in working capital.
Yaramoko Mine Complex
The Yaramoko Mine Complex is situated in the Houndé greenstone belt region in the Province of Balé in southwestern Burkina Faso. The property is located approximately 200 kilometres southwest from the capital city of Ouagadougou. The Yaramoko Mine Complex consists of two high-grade underground gold mines: the 55 Zone and Bagassi South.
Mine Operating Activities
|
|
Three months
ended
December 31
2020
|
Three months
ended
December 31
2019
|
Year ended
December 31
2020
|
Year ended
December 31
2019
|
|
|
|
|
|
|
|
Operating Data
|
|
|
|
|
|
Ore mined (tonnes)
|
149,347
|
140,583
|
506,109
|
479,929
|
|
Ore processed (tonnes)
|
128,060
|
131,439
|
512,276
|
466,157
|
|
Head grade (g/t)
|
9.3
|
9.8
|
8.5
|
9.5
|
|
Recovery (%)
|
98.2
|
98.3
|
98.0
|
98.2
|
|
Gold ounces produced
|
35,191
|
41,162
|
133,940
|
142,204
|
|
Gold ounces sold2
|
38,504
|
40,700
|
135,310
|
140,800
|
|
|
|
|
|
|
|
Financial Data (in thousands of dollars)
|
|
|
|
|
|
Gold sales1
|
72,155
|
60,208
|
239,686
|
196,151
|
|
Mine operating expenses2
|
(23,231)
|
(19,130)
|
(81,890)
|
(69,371)
|
|
Government royalties2
|
(4,340)
|
(4,296)
|
(14,392)
|
(10,680)
|
|
Depreciation and depletion2
|
(16,628)
|
(16,359)
|
(55,023)
|
(51,823)
|
|
|
|
|
|
|
|
Statistics (in dollars)
|
|
|
|
|
|
Average realized selling price (per ounce)
|
1,874
|
1,479
|
1,771
|
1,393
|
|
Cash operating cost (per tonne processed)2
|
152
|
146
|
152
|
149
|
|
Cash operating cost (per ounce produced)2
|
553
|
466
|
579
|
489
|
|
Total cash cost (per ounce sold)2
|
682
|
576
|
692
|
568
|
|
Sustaining capital cost (per ounce sold)2
|
180
|
269
|
262
|
216
|
|
Site all-in sustaining cost (per ounce sold)2
|
862
|
845
|
954
|
784
|
Health and safety performance
Safety is a core value of Roxgold. There was one Lost Time Injury (“LTI”) incident in 2020. The LTI was suffered by a contractor’s employee and marked the first LTI incident at the Yaramoko Gold Mine since September 2018. This led to a LTIFR of 0.37 per one million hours worked or one incident over 2.69 million man-hours in 2020.
Operational performance
The Company’s gold production in 2020 was 133,940 ounces at a head grade of 8.5 g/t compared to 142,204 ounces at 9.5 g/t in 2019.
Mining activities totalled 506,109 tonnes of ore mined at a grade of 8.4 g/t (includes marginal ore mined totalling 77,778 tonnes at a grade of 2.3 g/t) and 4,325 metres of waste development. This compares with 479,929 tonnes of ore at 8.9 g/t and 6,346 metres of waste development in 2019. The 55 Zone mine produced 326,416 tonnes at 8.61 g/t and the Bagassi South mine contributed 179,694 tonnes at a grade of 7.9 g/t.
The mining tonnage was attributable to the ramping up of stoping activities at the Bagassi South mine with stoping operations expanding following the completion of mine development in Q3 2020. During 2020, approximately 69% of ore produced came from stoping activities and 31% from development.
Decline development at the 55 Zone mine reached the 4674 level, approximately 650 metres below surface. Ore development continued down to 4694 level with seven levels developed during the year. The development of the Bagassi South mine was completed in Q3 2020 with the main decline reaching 5044 level, approximately 260 metres below surface. Ore development occurred on six levels and was completed in Q4 2020.
Mine reconciliation performance between the Mineral Reserve and Grade Control model was 107% for tonnes and 104% for grade for the year.
Three underground diamond drill rigs were mobilised to Yaramoko in August 2020 to begin grade control and resource definition drilling at the 55 Zone and at Bagassi South. A total of 14,608 metres were completed in 2020 with the drilling program continuing into the first half of 2021.
There was a record annual throughput of 512,276 ore tonnes processed in 2020, at head grade of 8.5 g/t, gold recovery of 98.1% and, plant availability of 96.3%; compared to 2019 when 466,157 ore tonnes were processed at 9.5 g/t head grade, 98.2% gold recovery and, availability of 96.2%.
The Yaramoko Gold Mine continued to maintain a low cash operating cost2 of $152 per tonne processed driven by increased throughput and strong cost control.
Financial Performance
Gold sales in 2020 totalled $239.7 million from 135,310 ounces of gold. The Company’s average realized gold price was $1,771 per ounce sold, 27% higher than the average realized gold price in 2019.
The Company maintained a cash operating cost2 per tonne processed of $152 per tonne. The cash operating cost2 per ounce produced totalled $579 per ounce for the year compared to $149 per tonne and $489 per ounce in the comparative period.
The total cash cost2 of $692 per ounce sold in 2020 was higher compared to $568 per ounce sold in 2019. This was primarily impacted by the processing of lower grade stockpiled material which had an impact of $35 per ounce sold, the higher gold price in 2020 which increased royalty payments by $19 per ounce sold, and the commencement of the 1% contribution to the Mining fund for local development increasing royalties by $18 per ounce sold.
As a result, the Company achieved a site all-in sustaining cost2 of $954 per ounce sold and an all-in sustaining cost2 of $1,004 per ounce sold in 2020 compared to $784 per ounce and $844 per ounce sold, respectively in the comparable period. The higher all-in sustaining cost in the year is attributed to the higher cash cost per ounce sold including the processing of marginal ore which had an impact of $35 per ounce sold, the higher gold price in 2020 which increased royalty payments by $19 per ounce sold, the commencement of the 1% contribution to the Mining fund for local development increasing royalties by $18 per ounce sold and increased underground development expenditure which had an impact of $46 per ounce sold.
The Company generated a mine operating margin2 of $1,079 per ounce in 2020 which was 31% higher than in 2019 mainly due to the higher average gold sales price.
The Company invested $23.2 million in underground mine development at the 55 Zone and $12.2 million at Bagassi South in 2020, compared to $25.3 million and $5.1 million respectively for the comparable period in 2019.
The Company generated strong cash flow from mining operations2 of $126.2 million in 2020, for cash flow from mining operations per share2 of $0.34 (C$0.45/share). Comparatively, the Company generated cash flow from mining operations2 of $98.3 million and $0.27 cash flow from mining operations per share2 in the prior year.
Exploration activities
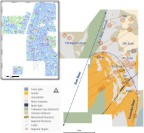
Exploration drilling testing the near surface potential on the Yaramoko permit commenced in the last quarter. Several areas were identified from a recent structural review including 109 Zone, where historic exploration had identified several prospective areas along a zone extending approximately 750m along strike and following up on several high-grade intervals from previous drilling close to Bagassi South. These intervals are interpreted as forming part of a larger vein system associated with the QV, QV1, QV2 and QV3 veins, and highlight the potential for additional extensions from the existing Bagassi South workings as well as potential open-pit opportunities. Several other early-stage opportunities have been identified across the Yaramoko property as part of a regional targeting exercise that will be followed up over the next 12 months to assess further near-surface mineralization opportunities.
Figure 1: Yaramoko regional prospects
Séguéla Gold Project
The Séguéla Gold Project is located in Côte d’Ivoire and was acquired by Roxgold in April 2019. The Project is located approximately 240 kilometres north-west of Yamoussoukro, the political capital of Côte d’Ivoire, and approximately 480 kilometres north-west of Abidjan, the commercial capital of the country. Séguéla consists of the resource-defined, near surface Antenna, Agouti, Boulder Ancien and Koula deposits that are ideally located near existing infrastructure including grid power, transport and water resources.
Project update
Mining permit
In December 2020, the Company received confirmation of the signed exploitation (mining) permit from the government of Côte d’Ivoire to develop and operate the Séguéla Gold Project in Côte d’Ivoire. Alongside this development, Roxgold has commenced early works at Séguéla to protect the project critical path and facilitate a rapid ramp up to full construction in 2021 pending the results of the feasibility study.
The exploitation permit has been approved by the Council of Ministers and signed as a mining decree by the President of Côte d’Ivoire, and other governmental authorities. The decree grants Roxgold an industrial mining permit for development and operation of the Séguéla Gold Project. The permit is valid for 10 years, from December 9, 2020, with opportunities to renew as further growth and expansion is proven. The Company’s final permitting milestone at Séguéla is the completion of the Mining Convention negotiation process.
Net Smelter Royalty buyback
In November 2020, the Company exercised its right of first refusal and repurchased a 0.3% Net Smelter Royalty (the “NSR”) from an original property owner with respect to the Company’s Séguéla Gold Project. The Company exercised its rights under the royalty agreement to pre-empt an arms-length acquisition between the original property owner and an international royalty company for consideration of $0.7 million cash.
After close of the transaction, Séguéla continues to have a 1.2% NSR held by another original property owner under similar terms including a right of first refusal and a right to acquire the remaining royalty for fair market value after a decision to mine has been made.
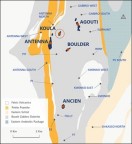
Exploration activities
Exploration activities have continued to progress to delineate additional mineral resources within close proximity to Antenna. The current targets, including the recent discovery of Koula, along with the previously defined Agouti, Boulder and Ancien, are within 6 kilometres of the Antenna deposit (Figure 2).
Significant progress was made on defining and extending mineralization at Koula with 4 RC/diamond core rigs active throughout the last quarter of 2020, along with further support drilling for the upcoming Feasibility Study, and ongoing target generation auger and scout RC drilling.
Figure 2: Séguéla deposits and satellite prospects
Koula
Located approximately 1 kilometre to the east of Antenna, the high grade Koula deposit was discovered through field reconnaissance and coincident recent artisanal workings in an area previously considered to be a lower exploration priority.
Drilling throughout the quarter focused on advancing the high grade Koula project to its maiden Inferred Resource of 281,000oz at 8.1g/t Au (refer to Company press release dated December 14, 2020). Drilling has continued to return very high-grade results from infill drilling to 25m centres, designed to advance Koula to Indicated Resource and its inclusion in the forthcoming Feasibility Study.
Displaying similar characteristics to those of Ancien in terms of host geology, mineralization style, high grade tenor and coarse visible gold, Koula remains open to the south with an interpreted southerly plunge remaining to be tested beyond the currently defined 500m down-plunge extent (Figure 3), with SGRD971 intersecting 14m at 4.3g/t Au from 276m. Mineralization is hosted by quartz-carbonate veining associated with a well developed mylonitic fabric within and along the interpreted margins of a tholeiitic basalt which in turn has been tightly folded. Coarse gold is commonly recorded in the higher-grade zones.
Highlights of recent results include:
-
12 metres (“m”) at 38.3 grams per tonne gold (“g/t Au”) in drill hole SGRD1065 from 180m including
-
4m at 104.4 g/t Au from 181m
-
16m at 28.3 g/t Au in drill hole SGRD1083 from 77m including
-
2m at 159.6 g/t Au from 83m
-
15m at 24.0 g/t Au in drill hole SGRC1025 from 42m including
-
3m at 95.7 g/t Au from 47m
-
9m at 30.5 g/t Au in drill hole SGRD1064 from 124m including
-
5m at 52.2 g/t Au from 124m
-
13m at 15.1 g/t Au in drill hole SGRD1032 from 189m including
-
3m at 42.7 g/t Au from 195m
-
11m at 13.9 g/t Au in drill hole SGRD1066 from 203m including
-
4m at 12.7 g/t Au from 205m and
-
1m at 72.3 g/t Au from 213m
-
5m at 19.1 g/t Au in drill hole SGRD1070 from 110m including
-
2m at 45.5 g/t Au from 112m
-
13m at 7.3 g/t Au in drill hole SGRD1034 from 108m including
-
2m at 30.7 g/t Au from 108m
-
10m at 9.4 g/t Au in drill hole SGRD1086 from 44m including
-
2m at 31.3 g/t Au from 47m
-
11m at 6.4 g/t Au in drill hole SGRD1029 from 34m including
-
2m at 14.4 g/t Au from 37m
Figure 3: Koula long section highlights
Refer to the Séguéla Technical Report for further details.
Séguéla Regional Reconnaissance
An extensive auger program continued during the quarter, testing areas to the south of Ancien and Siakasso North, with results highlighting several prospective areas which will be scheduled for follow-up aircore drilling in 2021. This testwork program is following up on the mapping and reconnaissance sampling at Séguéla which continues to emphasize the regional prospectivity of the property package with several prospects identified where rock chip samples recorded several instances of high-grade visible gold.
Boussoura Gold Project
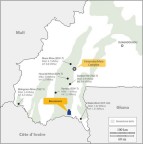
The Boussoura Project is located approximately 180 kilometers due south of Roxgold’s Yaramoko Project and 10 kilometers north of the border with Côte d’Ivoire. The project is situated in the prolific Houndé Belt, which is host to Yaramoko, as well as multiple other producing mines and large-scale discoveries. The Boussoura permits cover an area of over 25,000 hectares with an earn-in agreement in place for an additional 25,000 hectares of neighbouring permits.
Figure 4: Boussoura Project location on Houndé Belt
Exploration activities
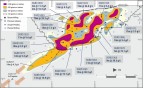
Fofora
The Fofora area is host to at least 9 sets of shear zones and vein corridors that have been identified to date within an active 3km by 3km artisanal field (Figure 5). Work in the quarter consisted of scout drilling testing the higher priority targets across the field, with results confirming extensive zones of mineralization within the corridors, as well as extension and infill drilling at Fofora Main. In addition to Fofora Main, drilling at the new VC2 prospect, approximately 500m to the west, has highlighted the potential for this to be an additional prospect. Drilling at VC2 has very similar host lithology and mineralization style to Fofora Main represented by at least 5 parallel vein sets extending more than 400m along strike. With the deepest drilling to approximately 150m below surface, VC2 remains open at depth.
A recently completed review of key structural controls has highlighted the interaction of a series of NNW striking vein arrays within a regionally extensive set of NE trending fractures, often developing repetitions of en echelon subparallel zones as seen at Fofora Main, along with preferred host volcanic and intrusive lithologies. Mineralization is typically associated with a series of sheared felsic dykes, associated quartz veining and intense silica alteration and replacement, with a variable dip from steep westerly to ~70 degrees east with coarse gold commonly seen in samples.
Drilling at Fofora Main has intersected additional parallel veins to the east, with at least five vein sets identified as forming the bulk of Fofora Main. Results include 3.9m at 14.4 g/t Au in BSR-20-RD-FFR-107 from 96.4m and 10.7m at 5.6 g/t Au in BSR-20-RD-FFR-106 from 103m, with mineralization identified along approximately 700m of strike and 200m across strike. Further work is planned to continue to test for additional eastern footwall lodes as well as continuing to define the deposit dimensions as it remains open along strike and at depth.
Figure 5: Assay results from Fofora Main and VC2
Highlights from recent drilling include:
Fofora Main
-
10.7m at 5.6 g/t Au in drill hole BSR-20-RD-FFR-106 from 103m including:
-
1m at 27.4 g/t Au from 103m
-
3.9m at 14.4 g/t Au in drill hole BSR-20-RD-FFR-107 from 96.4m including:
-
1m at 52.3 g/t Au from 97.8m
-
15.0m at 1.9 g/t Au in drill hole BSR-20-RC-FFR-100 from 82m
-
18.9m at 1.3 g/t Au in drill hole BSR-20-RC-FFR-98 from 112m
VC2:
-
5m at 17.0 g/t Au in drill hole BSR-20-RC-FFR-142 from 59m including:
-
2m at 40.9 g/t Au from 60m
-
8m at 7.4 g/t Au in drill hole BSR-20-RC-FFR-150 from 100m including:
-
1m at 48.9 g/t Au from 105m
-
10m at 2.0 g/t Au in drill hole BSR-20-RC-FFR-134 from 28m, followed by separate intervals of:
-
14m at 3.6 g/t Au from 44m; and
-
3m at 15.6 g/t Au from 79m
-
23m at 2.0 g/t Au in drill hole BSR-20-RC-FFR-143 from 41m
-
19.4m at 1.1 g/t Au in drill hole BSR-20-RD-FFR-120 from 55.4m, followed by a separate interval of:
-
5.4m at 5.4 g/t Au from 166m
-
11m at 1.9 g/t Au in drill hole BSR-20-RD-FFR-099 from 123m
-
4m at 4.7 g/t Au in drill hole BSR-20-RC-FFR-149 from 77m including:
-
1m at 12.3 g/t Au from 78m
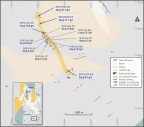
Galgouli
Exploration activities at Galgouli during the quarter has transitioned to target delineation with an extensive auger program underway testing the northern and southern strike extension of the Galgouli structure and potential parallel zones. Several additional anomalies have been identified and are awaiting scout RC drill testing. Strike extension testing on 400m spaced drill fences along strike from Galgouli has been successful in intersecting several zones interpreted as representing continuation of the main structure, with results including 3m at 21.3 g/t Au from 47m in BSR-20-RC-020 and 3m at 11.7 g/t Au from 105m in BSR-20-RC-019, with mineralization extending over 2.5km along strike.
Figure 6: Assay results from Galgouli
Refer to Company press release dated February 1, 2021 for further information.
Mineral Reserves and Resources Estimate
Yaramoko
Proven and Probable Mineral Reserves at Yaramoko increased 8% to 710,000 oz Au, net of mining depletion of 207,396 oz Au at an average processed head grade of 9.2 g/t, from the period of December 31, 2018 to June 30, 2020. Measured and Indicated Mineral Resources increased 4% to 857,000 oz Au from 827,000 oz Au relative to the December 31, 2018 estimate (refer to Company press release dated July 11, 2019 for further details with respect to the December 31, 2018 estimates).
The increase in Mineral Reserves and Measured and Indicated Mineral Resources is primarily attributed to the success of a prior drilling program that delineated mineralization in the near-surface portion of the 55 Zone, intersecting several high-grade intervals close to surface and above zones previously mined from underground in the early stages of the 55 Zone mining operation. The objective of this drill program was to determine the potential for an open pit operation to complement the high-grade underground operation and extend the mine life at the 55 Zone (refer to Company press release dated September 30, 2020).
Table 1 – Yaramoko June 2020 Mineral Reserve Estimate
|
|
Proven
|
Probable
|
Proven & Probable
|
|
Tonnes
|
Grade
|
Metal
|
Tonnes
|
Grade
|
Metal
|
Tonnes
|
Grade
|
Metal
|
|
(kt)
|
(g/t Au)
|
(000 oz)
|
(kt)
|
(g/t Au)
|
(000 oz)
|
(kt)
|
(g/t Au)
|
(000 oz)
|
|
Stockpiles
|
131
|
3.4
|
14
|
–
|
–
|
–
|
131
|
3.4
|
14
|
|
55 Zone
|
|
|
|
|
|
|
|
|
|
|
Open pit
|
–
|
–
|
–
|
820
|
7.2
|
190
|
820
|
7.2
|
190
|
|
Underground
|
262
|
6.0
|
51
|
1,354
|
7.2
|
314
|
1,616
|
7.0
|
365
|
|
Bagassi South
|
|
|
|
|
|
|
|
|
|
|
Underground
|
–
|
–
|
–
|
576
|
7.6
|
141
|
576
|
7.6
|
141
|
|
Total
|
393
|
5.1
|
65
|
2,750
|
7.3
|
645
|
3,143
|
7.0
|
710
|
Notes:
(1) Mineral Reserves are reported in accordance with NI 43-101 with an effective date of June 30, 2020, for the Yaramoko Gold Mine.
(2) The Yaramoko Mineral Reserves are reported on a 100% basis at a gold grade cut-off of 0.9g/t Au for the 55 Zone open pit, 3.1g/t Au for 55 Zone underground and 2.8g/t Au for Bagassi South Underground, based on a gold price of US$1,500/ounce. Reported Mineral Reserves account for mine depletion and stockpile activities as at June 30, 2020.
(3) The Yaramoko Underground Mineral Reserve Statement was prepared under the supervision of Mr. Ashraf Suryaningrat, Senior Mine Engineer at Roxgold Inc. Mr. Suryaningrat is a Qualified Person as defined in NI 43-101.
(4) The Yaramoko Open pit Mineral Reserve Statement was prepared under the supervision of Mr. David Whittle, General Manager – Yaramoko at Roxgold Inc. Mr. Whittle is a Qualified Person as defined in NI 43-101.
(5) All figures have been rounded to reflect the relative accuracy of the estimates and totals may not add due to rounding.
(6) The Yaramoko Gold Project is subject to a 10% carried interest held by the government of Burkina Faso
Table 2 – Yaramoko June 2020 Mineral Resource Estimate
|
|
Measured
|
Indicated
|
Measured & Indicated
|
Inferred
|
|
Tonnes
|
Grade
|
Metal
|
Tonnes
|
Grade
|
Metal
|
Tonnes
|
Grade
|
Metal
|
Tonnes
|
Grade
|
Metal
|
|
(kt)
|
(g/t Au)
|
(000 oz)
|
(kt)
|
(g/t Au)
|
(000 oz)
|
(kt)
|
(g/t Au)
|
(000 oz)
|
(kt)
|
(g/t Au)
|
(000 oz)
|
|
Stockpiles
|
131
|
3.4
|
14
|
–
|
–
|
–
|
131
|
3.4
|
14
|
–
|
–
|
–
|
|
55 Zone
|
|
|
|
|
|
|
|
|
|
|
|
|
|
Open pit
|
–
|
–
|
–
|
972
|
7.7
|
240
|
972
|
7.7
|
240
|
202
|
4.4
|
29
|
|
Underground
|
220
|
9.5
|
67
|
894
|
12.4
|
356
|
1,115
|
11.8
|
423
|
178
|
8.1
|
46
|
|
Bagassi South
|
|
|
|
|
|
|
|
|
|
|
|
|
|
Underground
|
–
|
–
|
–
|
436
|
12.9
|
180
|
436
|
12.8
|
180
|
176
|
8.1
|
46
|
|
Total
|
351
|
7.2
|
81
|
2,303
|
10.5
|
776
|
2,654
|
10.0
|
857
|
556
|
6.8
|
121
|
Notes:
(1) Mineral Resources are reported in accordance with NI 43-101 with an effective date of June 30, 2020, for the Yaramoko Gold Mine.
(2) The Yaramoko Mineral Resources are reported on a 100% basis at a gold grade cut-off of 0.5g/t Au for the 55 Zone open pit and 2.7g/t Au for underground, based on a gold price of US$1,700/ounce; with the 55 Zone open pit constrained to an MII pit optimisation shell. Reported Mineral Resources account for mine depletion and stockpile activities as at June 30, 2020.
(3) The identified Mineral Resources are classified according to the “CIM” definitions for the Measured, Indicated, and Inferred categories. The Mineral Resources are reported in situ without modifying factors applied.
(4) The Yaramoko Mineral Resource Statement was prepared under the supervision of Mr. Hans Andersen, Senior Resource Geologist at Roxgold Inc. Mr. Andersen is a Qualified Person as defined in NI 43-101.
(5) All figures have been rounded to reflect the relative accuracy of the estimates and totals may not add due to rounding.
(6) Mineral Resources that are not Mineral Reserves do not necessarily demonstrate economic viability.
(7) Mineral Resources are reported inclusive of Mineral Reserves
(8) The Yaramoko Gold Project is subject to a 10% carried interest held by the government of Burkina Faso
Séguéla Gold Project
In December 2020, the Company reported an updated Mineral Resource Estimate for the Séguéla Gold Project (“Séguéla”) located in Côte d’Ivoire. The updated Séguéla NI 43-101 Mineral Resource estimate includes an additional 56,600 m of Reverse Circulation (“RC”) and diamond core (“DD”) drilling since the completion of the Séguéla PEA in April 2020. The drill program prioritized infill drilling of Antenna, Ancien, Boulder and Agouti to increase resource confidence, while rapidly advancing the high grade Koula discovery to its maiden Inferred Resource (refer to Company press release dated December 14, 2020).
Total Indicated Mineral Resources increased 97% to 1,044,000 ounces (“oz”) of gold grading 2.5 grams per tonne (“g/t”) since the Preliminary Economic Assessment (“PEA”) was released in April 2020 (refer to Company press release dated April 14, 2020). Total Inferred Mineral Resources are estimated at 370,000 oz at 4.8 g/t, due to the contribution of a maiden Mineral Resource estimate from the recently discovered high grade Koula prospect, which returned Inferred Mineral Resources of 281,000oz at 8.1 g/t.
Table 3 – Séguéla November 2020 Mineral Resource Estimate
|
|
Measured
|
Indicated
|
Measured & Indicated
|
Inferred
|
|
Tonnes
|
Grade
|
Metal
|
Tonnes
|
Grade
|
Metal
|
Tonnes
|
Grade
|
Metal
|
Tonnes
|
Grade
|
Metal
|
|
(kt)
|
(g/t Au)
|
(000 oz)
|
(kt)
|
(g/t Au)
|
(000 oz)
|
(kt)
|
(g/t Au)
|
(000 oz)
|
(kt)
|
(g/t Au)
|
(000 oz)
|
|
Antenna
|
–
|
–
|
–
|
8,180
|
2.2
|
586
|
8,180
|
2.2
|
586
|
1,110
|
1.9
|
69
|
|
Ancien
|
–
|
–
|
–
|
1,440
|
5.4
|
250
|
1,440
|
5.4
|
250
|
30
|
10.6
|
11
|
|
Agouti
|
–
|
–
|
–
|
1,420
|
2.4
|
111
|
1,420
|
2.4
|
111
|
100
|
1.8
|
6
|
|
Boulder
|
–
|
–
|
–
|
1,740
|
1.7
|
97
|
1,740
|
1.7
|
97
|
80
|
1.2
|
3
|
|
Koula
|
–
|
–
|
–
|
–
|
–
|
–
|
–
|
–
|
–
|
1,080
|
8.1
|
281
|
|
Total
|
–
|
–
|
–
|
12,780
|
2.5
|
1,044
|
12,780
|
2.5
|
1,044
|
2,400
|
4.8
|
370
|
Notes:
(1) Mineral Resources are reported in accordance with NI 43-101 with an effective date of November 30, 2020, for the Séguéla Gold Project
(2) The Séguéla Mineral Resources are reported on a 100% basis at a gold grade cut-off of 0.3g/t Au for the Antenna deposit and 0.5g/t Au for the satellite deposits, based on a gold price of US$1,700/ounce and constrained to an MII pit optimisation shell.
(3) The identified Mineral Resources are classified according to the “CIM” definitions for the Measured, Indicated, and Inferred categories. The Mineral Resources are reported in situ without modifying factors applied.
(4) The Séguéla Mineral Resource Statement was prepared under the supervision of Mr. Hans Andersen, Senior Resource Geologist at Roxgold Inc. Mr. Andersen is a Qualified Person as defined in NI 43-101.
(5) All figures have been rounded to reflect the relative accuracy of the estimates and totals may not add due to rounding.
(6) Mineral Resources that are not Mineral Reserves and do not necessarily demonstrate economic viability.
(7) Mineral Resources are reported inclusive of Mineral Reserves.
(8) The Séguéla Gold Project is subject to a 10% carried interest held by the government of Côte d’Ivoire.
Table 4 – Séguéla Mineral Resource Comparison
|
|
PRIOR
as at April 14, 2020(3)
|
UPDATED
as at November 30, 2020
|
|
|
|
Tonnes
|
Grade
|
Metal
|
Tonnes
|
Grade
|
Metal
|
% Change
|
|
(kt)
|
(g/t Au)
|
(000 oz)
|
(kt)
|
(g/t Au)
|
(000 oz)
|
Metal
|
|
Mineral Resource
|
|
|
|
|
|
|
|
|
Measured
|
–
|
–
|
–
|
–
|
–
|
–
|
0%
|
|
Indicated
|
7,100
|
2.3
|
529
|
12,780
|
2.5
|
1,044
|
+97%
|
|
Measured & Indicated
|
7,100
|
2.3
|
529
|
12,780
|
2.5
|
1,044
|
+97%
|
|
Inferred
|
5,400
|
2.9
|
508
|
2,400
|
4.8
|
370
|
-27%
|
Notes:
(1) Mineral Resources are reported in accordance with NI 43-101.
(2) All figures have been rounded to reflect the relative accuracy of the estimates and totals may not add due to rounding.
(3) Refer to SEDAR for NI 43-101 Technical Report titled ‘Séguéla Project Preliminary Economic Assessment, Worodougou Region, Côte d’Ivoire’ effective date of April 14, 2020.
Corporate Social Responsibility Activities (“CSR”)
2020 Highlights
Despite COVID-19 worldwide outbreak, Roxgold has continued to focus on its sustainability priorities due to its flexible and collaborative approach with its employees, contractors, communities, and governments.
Highlights for 2020 include the following:
-
A Lost Time Injury Frequency Rate (“LTIFR”) per 1 million hours of 0.37 for 2.69 million man-hours and one lost time incident on a 12-month period, while the Total Recordable Injury Frequency Rate (“TRIFR”) per 1 million hours was 3.71.
-
Successful implementation of a COVID-19 management plan as early as February, protecting the employees and surrounding communities without any downtime in production.
-
Continuity of our sustainability programs with no significant environmental or community issue while addressing the operational challenges of managing COVID-19.
-
Séguéla Project significantly advanced with the full support of local communities and the approval of the government granting the environmental and exploitation permits.
2021 CSR program
The 2021 Corporate Social Responsibility will focus on adapting our previous programs to maintain the same overall performance while facing COVID-19 challenges.
Our CSR programs aim to:
-
Put the health and safety of our stakeholders at the top priority
-
Control and prevent the risks associated with our operations including environmental and social matters
-
Develop our employee skills and behavior of safety and social responsibility best practices
-
Support the fight against COVID-19 and malaria diseases at our mines and in the nearby communities
-
Build meaningful and respectful relationships in and around the communities where we operate
-
Reduce our footprint through conservation, protection and rehabilitation of biodiversity where possible
-
Ensure extensive and participative monitoring to better protect the environment and to help local stakeholders understand the mitigation and enhancement measures put in place
Conference Call and Webcast Information
The Company will host a conference call and live webcast on Thursday, March 4th, 2021 at 8:00 am ET to discuss its financial results and business outlook.
Listeners may access a live webcast of the conference call from the events section of the Company’s website at www.roxgold.com or to participate in the live conference call by dialing toll free 1 (844) 607-4367 within North America or +1 (825) 312-2266 from international locations. Registration is open through the live call, but to ensure you are connected for the full call, we suggest registering a minimum of 10 minutes before the start of the call.
An online archive of the webcast will be available by accessing the Company’s website at www.roxgold.com. A telephone replay will be available for two weeks after the call by dialing toll free 1 (800) 585-8367 within North American or +1 (416) 621-4642 from international locations and entering passcode: 638 3668.
Notes:
-
For the twelve-month period ended December 31, 2019, gold ounces sold, and gold sales include pre-commercial production ounces sold of 10,144 ounces and revenues of $14.2 million. The pre-commercial production gold sales and mine operating expenses were accounted against Property, Plant and Equipment.
-
The Company provides some non-IFRS measures as supplementary information that management believes may be useful to investors to explain the Company’s financial results. Please refer to note 18 “Non-IFRS financial performance measures” of the Company’s MD&A dated March 3, 2021, available on the Company’s website at www.roxgold.com or on SEDAR at www.sedar.com for reconciliation of these measures.
-
This is a non-IFRS Financial performance measure with no standard definition under IFRS. Free cashflow (before growth spend) is defined as cashflow from operating activities less cashflow from investing activities excluding growth expenditure (i.e. exploration expenditures).
-
For twelve-month period ended December 31, 2019, mine operating profit includes $3.3 million respectively relating to Bagassi South pre-production revenue net of expenses related to the 10,144 ounces sold respectively.
Qualified Persons
Paul Criddle, FAusIMM, Chief Operating Officer for Roxgold Inc., a Qualified Person within the meaning of National Instrument 43-101, has reviewed, verified and approved the technical disclosure contained in this news release.
Paul Weedon, MAIG, Vice-President, Exploration for Roxgold Inc., a Qualified Person within the meaning of National Instrument 43-101, has verified and approved the technical disclosure contained in this news release. This includes the QA/QC, sampling, analytical and test data underlying this information. For more information on the Company’s QA/QC and sampling procedures, please refer to the Company’s Annual Information Form dated December 31, 2019, available on the Company’s website at www.roxgold.com and on SEDAR at www.sedar.com.
For further information regarding the Yaramoko Gold Mine, please refer to the technical report dated December 20, 2017, and entitled “Technical Report for the Yaramoko Gold Mine, Burkina Faso” (the “Yaramoko Technical Report”) and the technical report prepared for the Séguéla Gold Project entitled “NI 43-101 Technical Report, Séguéla Project, Worodougou Region, Côte d’Ivoire” dated November 30, 2020 (the “Séguéla Technical Report”) and together with the Yaramoko Technical Report, the “Technical Reports” available on the Company’s website at www.roxgold.com and on SEDAR at www.sedar.com.
About Roxgold
Roxgold is a Canadian-based gold mining company with assets located in West Africa. The Company owns and operates the high-grade Yaramoko Gold Mine located on the Houndé greenstone belt in Burkina Faso and is advancing the development and exploration of the Séguéla Gold Project located in Côte d’Ivoire. Roxgold trades on the TSX under the symbol ROXG and as ROGFF on OTCQX.
This press release contains “forward-looking information” within the meaning of applicable Canadian securities laws (“forward-looking statements”). Such forward-looking statements include, without limitation: economic statements with respect to Mineral Reserves and Mineral Resource estimates (including proposals for the potential growth, extension and/or upgrade thereof and any future economic benefits which may be derived therefrom), future production and life of mine estimates, production and cost guidance, anticipated recovery grades, and potential increases in throughput, the anticipated increased proportion of mill feed coming from stoping ore, future capital and operating costs and expansion and development plans including with respect to the 55 zone and Bagassi South, and the expected timing thereof (including with respect to the delivery of ore and future stoping operations), proposed exploration plans and the timing and costs thereof, the anticipated operations, costs, proposed funding, timing and other factors set forth in the Technical Report, and sufficiency of future funding. These statements are based on information currently available to the Company and the Company provides no assurance that actual results will meet management’s expectations. In certain cases, forward-looking information may be identified by such terms as “anticipates”, “believes”, “could”, “estimates”, “expects”, “may”, “shall”, “will”, or “would”. Forward-looking information contained in this news release is based on certain factors and assumptions regarding, among other things, the estimation of Mineral Resources and Mineral Reserves, the realization of resource estimates and reserve estimates, gold metal prices, the timing and amount of future exploration and development expenditures, the estimation of initial and sustaining capital requirements, the estimation of labour and operating costs, the availability of necessary financing and materials to continue to explore and develop the Yaramoko Gold Project and other properties including the Séguéla Gold Project in the short and long-term, the progress of exploration and development activities as currently proposed and anticipated, the receipt of necessary regulatory approvals and permits, and assumptions with respect to currency fluctuations, environmental risks, title disputes or claims, and other similar matters, as well as assumptions set forth in the Company’s technical report dated December 20, 2017, and entitled “Technical Report for the Yaramoko Gold Mine, Burkina Faso” (the “Yaramoko Technical Report”) and the technical report prepared for the Séguéla Gold Project entitled NI 43-101 Technical Report, Séguéla Project, Worodougou Region, Côte d’Ivoire” dated November 30, 2020 (the “Séguéla Technical Report” and together with the Yaramoko Technical Report, the “Technical Reports” available on the Company’s website at www.roxgold.com and SEDAR at www.sedar.com. While the Company considers these assumptions to be reasonable based on information currently available to it, they may prove to be incorrect.
Although the Company believes the expectations expressed in such forward-looking statements are based on reasonable assumptions, such statements are not guarantees of future performance and actual results or developments may differ materially from those in the forward-looking statements. Factors that could cause actual results to differ materially from those in forward-looking statements include: delays resulting from the COVID-19 pandemic, changes in market conditions, unsuccessful exploration results, possibility of project cost overruns or unanticipated costs and expenses, changes in the costs and timing of the development of new deposits, inaccurate reserve and resource estimates, changes in the price of gold, unanticipated changes in key management personnel, failure to obtain permits as anticipated or at all, failure of exploration and/or development activities to progress as currently anticipated or at all, and general economic conditions. Mining exploration and development is an inherently risky business. Accordingly, actual events may differ materially from those projected in the forward-looking statements. This list is not exhaustive of the factors that may affect any of the Company’s forward-looking statements. These and other factors should be considered carefully and readers should not place undue reliance on the Company’s forward-looking statements. The Company does not undertake to update any forward-looking statement that may be made from time to time by the Company or on its behalf, except in accordance with applicable securities laws.

View source version on businesswire.com: https://www.businesswire.com/news/home/20210303006002/en/
Roxgold Inc.
Graeme Jennings, CFA
Vice President, Investor Relations
416-203-6401
[email protected]
KEYWORDS: North America Canada
INDUSTRY KEYWORDS: Mining/Minerals Natural Resources
MEDIA:
| Logo |
 |
|
| Photo |
 |
| Figure 4. Boussoura Project location on Hounde Belt (Graphic: Business Wire) |
| Photo |
 |
| Figure 3. Koula long section highlights (Graphic: Business Wire) |
| Photo |
 |
| Figure 5. Assay results from Fofora Main and VC2 (Graphic: Business Wire) |
| Photo |
 |
| Figure 6. Assay results from Galgouli (Graphic: Business Wire) |
| Photo |
 |
| Figure 1. Yaramoko regional prospects (Graphic: Business Wire) |
| Photo |
 |
| Figure 2. Seguela deposits and satellite prospects (Graphic: Business Wire) |