ADS-TEC Energy Establishes First North American Site for Its Ultra-Fast Charging Technology in Auburn, Alabama
- ADS-TEC Energy to invest $8 million dollars in sales, warehousing, service and assembly facility, creating approximately 180 jobs
- Alabama Governor Kay Ivey supports ADS-TEC Energy and facilitates grants
- ADS-TEC Energy will produce battery-backed ultra-fast charging solutions for e-vehicles in the U.S. market
NÜRTINGEN, Germany & AUBURN, Ala.–(BUSINESS WIRE)–ADS-TEC Energy (NASDAQ: ADSE), a leader in battery-buffered, ultra-fast-charging solutions, today announced it is establishing its first dedicated facility in North America in Auburn, Ala., bringing together sales, warehousing, service and assembly in the new location. The company expects its new site in the United States to be fully functional by 2024, expanding ADS-TEC Energy’s manufacturing to include both Germany and the U.S. ADS-TEC Energy plans invest $8 million and create approximately 180 jobs in the coming years associated with the new site, which will facilitate the expansion of e-vehicle charging infrastructure in the U.S.
This press release features multimedia. View the full release here: https://www.businesswire.com/news/home/20221220005517/en/
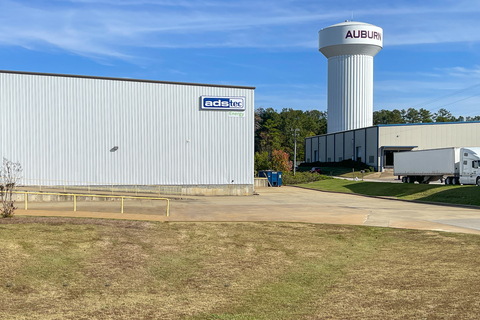
ADS-TEC Energy, a leader in battery-buffered, ultra-fast-charging solutions, today announced it is establishing its first dedicated facility in North America in Auburn, Ala., bringing together sales, warehousing, service and assembly in the new location. (Photo: Business Wire)
“We’re excited to welcome yet another high-tech German company to Alabama,” Governor Kay Ivey said. “The partnership between German engineering and Alabama manufacturing has brought many innovative products to the North American market. We’re excited to add ADS-TEC Energy’s battery-buffered fast charging stations to that list, serving the quickly growing electric vehicle market.”
“The City of Auburn is grateful for the trust that Thomas Speidel and his team have in our community, and we will do everything we can to support ADS-TEC Energy in establishing a successful operation in Auburn,” Mayor Ron Anders said. “The assembling and servicing of innovative equipment for the emerging electric charging infrastructure market right here in Auburn will create well-paying and clean high-tech jobs for Auburn residents.”
Auburn, Ala.– important business location in the U.S.
Auburn, Ala. is an important business location in the U.S. Among others, companies from the aerospace sector are located there, including Airbus and NASA. Automotive leader Mercedes-Benz has been based in Auburn since 1993, followed by Honda, Hyundai and Toyota. It is also home to many small- and mid-sized, technology-based, value-added manufacturing companies in the automotive, distribution and technology-based industries. Auburn University is a training ground for talented professionals. The crew for NASA’s current Artemis I lunar mission includes numerous Auburn University alumni. ADS-TEC intends to develop a cooperative program with Auburn University, providing students and new graduates with positions in production and management. It will also cooperate with Alabama-based companies, wherever possible.
ADS-TEC Energy ultra-fast charging systems – powerful, reliable and optimum TCO
With its ChargeBox and ChargePost systems, ADS-TEC has developed powerful, reliable technologies with an optimal long-term total cost of ownership (TCO). Both systems can be installed quickly and easily—connected to the existing, limited-power electrical grid, without requiring any expansion of the network—and offer the industry’s highest rates of ultra-fast charging. The company’s latest ultra-fast charging solution, ChargePost, integrates two charging dispensers that combine power electronics, battery storage and air conditioning with up to two 75-inch displays in an extremely powerful, compact and quiet “all-in-one” system. ChargePost is available currently in Europe and will soon be available in the U.S.
ADS-TEC Energy Founder and CEO Thomas Speidel said, “We are very pleased to announce significant progress in the U.S. Having been listed on NASDAQ for less than a year, we already have a successful market presence in the Americas, and now are establishing a new location for sales, warehousing, service and assembly of our fast-charging systems in Auburn, supported by a strong economic environment driven by innovation and growth. We are very grateful for the intensive support of the local economic development agency and the State of Alabama, especially Governor Kay Ivey, and the open doors of the local decision-makers, who have given us constructive support. ADS-TEC is ‘Engineered in Germany,’ and we are proud to extend our quality products to the U.S.,” he added.
ADS-TEC Energy’s charging technology was nominated for the German Future Prize in 2022 by the President of the Federal Republic of Germany and elevated to the “circle of excellence.”
About ADS-TEC Energy
ADS-TEC Energy plc, a public limited company incorporated in Ireland and publicly listed on NASDAQ (“ADS-TEC Energy”), serves as a holding company for ads-tec Energy GmbH, our operating company incorporated in Germany (“ADSE GM”) and ads-tec Energy Inc., a US subsidiary of ads-tec Energy GmbH (“ADSE US” and together with ADS-TEC Energy and ADSE GM, “ADSE”). Based on more than ten years of experience with lithium-ion technologies, ADS-TEC Energy develops and manufactures battery storage solutions and fast charging systems including their energy management systems. Its battery-based, fast charging technology enables electric vehicles to ultrafast charge even on low powered grids and features a very compact design. The high quality and functionality of the battery systems are due to a particularly high depth of development and in-house production. With its advanced system platforms, ADS-TEC Energy is a valuable partner for automotive, OEMs, utility companies and charge-operators.
More information: www.adstec-energy.com
Forward-Looking Statements
This press release contains forward-looking statements within the meaning of the “safe harbor” provisions of the Private Securities Litigation Reform Act of 1995. Words such as “expect,” “estimate,” “project,” “budget,” “forecast,” “anticipate,” “intend,” “plan,” “may,” “will,” “could,” “should,” “believes,” “predicts,” “potential,” “continue,” and similar expressions are intended to identify such forward-looking statements. These forward-looking statements include statements regarding our expectations with respect to future performance and the anticipated timing of certain commercial activities, such as the Company’s plans to invest $8 million and create about 180 jobs over the next two years, the Company’s timeline for the Auburn technology site to reach full capacity, the Company’s plans to make charging stations available in each state in the U.S. and the availability of the ChargePost in the U.S. in the future. There are a significant number of factors that could cause actual results to differ materially from the statements made in this press release, including: the impact of the COVID-19 pandemic, geopolitical events including the Russian invasion of Ukraine, macroeconomic trends including changes in inflation or interest rates, or other events beyond our control on the overall economy, our business and those of our customers and suppliers, including due to supply chain disruptions and expense increases; our limited operating history as a public company; our dependence on widespread acceptance and adoption of EVs and increased installation of charging stations; our current dependence on sales to a limited number of customers for most of our revenues; overall demand for EV charging and the potential for reduced demand for EVs if governmental rebates, tax credits and other financial incentives are reduced, modified or eliminated or governmental mandates to increase the use of EVs or decrease the use of vehicles powered by fossil fuels, either directly or indirectly through mandated limits on carbon emissions, are reduced, modified or eliminated; supply chain interruptions and expense increases; unexpected delays in new product introductions; our ability to expand our operations and market share in Europe and the U.S.; the effects of competition; changes to battery energy storage standards; and the risk that our technology could have undetected defects or errors. Additional risks and uncertainties that could affect our financial results are included under “Item 3. Key Information – 3.D. Risk Factors” in our annual report on Form 20-F filed with the Securities and Exchange Commission (the “SEC”) on April 28, 2022, which is available on our website at https://adstec-energy.com/corporate-governance/ and on the SEC’s website at www.sec.gov. Additional information will also be set forth in other filings that we make with the SEC from time to time. All forward-looking statements in this press release are based on information available to us as of the date hereof, and we do not assume any obligation to update the forward-looking statements provided to reflect events that occur or circumstances that exist after the date on which they were made, except as required by applicable law.
View source version on businesswire.com: https://www.businesswire.com/news/home/20221220005517/en/
Media:
For ADS-TEC Energy – Germany
Dennis Müller
SVP Product Marketing & Communication
[email protected]
For ADS-TEC Energy – US
Barbara Hagin
Breakaway Communications
+1 408-832-7626
[email protected]
Scott Gamm
Strategy Voice Associates
+1 917-626-9515
[email protected]
KEYWORDS: Germany Europe United States North America Alabama
INDUSTRY KEYWORDS: Alternative Vehicles/Fuels Technology EV/Electric Vehicles Vehicle Technology Automotive General Automotive Other Automotive Alternative Energy Energy Batteries
MEDIA:
| Logo |
| Photo |
 |
| ADS-TEC Energy, a leader in battery-buffered, ultra-fast-charging solutions, today announced it is establishing its first dedicated facility in North America in Auburn, Ala., bringing together sales, warehousing, service and assembly in the new location. (Photo: Business Wire) |