Bruker Introduces Novel 4D-Proteomics™timsTOF® Capabilities
- New AI-powered TIMSquant™ software for CCS-enabled, label-free quantification scalable to thousands of samples
- Early midia-PASEF® access for immunopeptidomics and PTMs on ultra-sensitive timsTOF Ultra for DDA-like precursor traceability in dia-PASEF
- Affordable, high-throughput ~3,500 PG plasma proteomics on timsTOF HT with PreOmics ENRICH kit using Biognosys Spectronaut® 18 directDIA+™ software
- New PepSep™ ULTRA XL and MAX HT nano-LC columns for DDA library creation and high-throughput proteomics, respectively
- Novel TwinScape™ digital twin for optimal timsTOF performance and uptime
- New partnership with Mass Dynamics for biological knowledge generation
- Enhanced MALDI HiPLEX-IHC workflow for spatial tissue proteomics
- New MetaboScape™ release for 4D-Lipidomics™ and 4D-Metabolomics™
BUSAN, South Korea–(BUSINESS WIRE)–
At the 22nd Human Proteome Organization World Congress 2023, Bruker Corporation (Nasdaq: BRKR) today announced advances in instrumental methods, consumables and software for 4D-Proteomics, MALDI HiPLEX-IHC spatial tissue proteomics, 4D-Lipidomics and 4D-Metabolomics.
This press release features multimedia. View the full release here: https://www.businesswire.com/news/home/20230918138030/en/
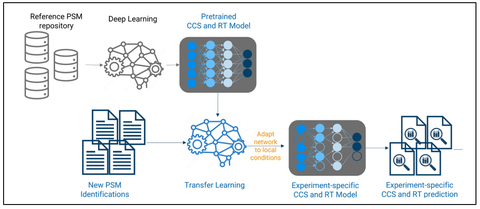
Fig. 1: TIMSquant for CCS-aware, AI-powered quantification (Graphic: Business Wire)
A. Novel scalable AI-powered TIMSquant™ for label-free quantification
Bruker introduces TIMSquant a scalable, CCS-enabled AI-powered label-free quantification algorithm integrated into Bruker ProteoScape™. TIMSquant performs accurate quantification of peptides and proteins present in 100s or 1000s samples by using global retention time and collision cross-section (CCS) prediction models. Accurate, large-scale CCS data further increases specificity and quantification consistency based on previously identified peptides and aligned missing values.
Bruker ProteoScape is Bruker’s comprehensive GPU-powered, TIMS DIA-NN-based proteomics software optimized for CCS-centric informatics, and it now comes with the BPS Novor module for de novo peptide sequencing for immunopeptidomics. BPS Novor was co-developed with Rapid Novor Inc., a Canadian software and CRO company. TIMS DIA-NN is a customized version of highly regarded DIA-NN software by Demichev and collaborators.
Dr. Kosuke Ogata, Assistant Professor at Kyoto University, commented: “Ultra-high speed LC-MS from large-scale clinical cohorts harnessing the high duty-cycle of timsTOF technology is a focus of our laboratory. Analysis of non-proteotypic peptides is critical to our research. We have installed the BPS Novorde novo software on Bruker ProteoScape (formerly PaSER) and we are impressed with the real-time speed and high-quality de novo sequences produced.”
Dr. Hanno Steen, Associate Professor at Harvard Medical School & Director of Proteomics at Boston Children’s Hospital, stated: “We focus on the discovery and validation of biomarkers from body fluids, such as plasma, serum, CSF, saliva and urine in high throughput. We leverage the robustness of our timsTOF instruments and real-time Bruker ProteoScape to build large spectral libraries and analyze 1000s of clinical research samples. We have recently expanded our bioinformatics pipeline to run on ProteoScape, and are truly excited by the realistic potential to apply this for the analysis of 10,000s of LC/MS runs in real time to decipher the pathology of pediatric, immunologic, and neurological diseases.”
B. Novel dia-PASEF scan modes
Bruker offers selected upgrades to timsControl acquisition software with the key advances of 300 Hz PASEF and VistaScan™ technology as downloads from the Bruker web page (Reference 3). The 300Hz dda-PASEF acquisition now allows up to 18,000 CCS-enabled MS/MS spectra per minute with very short LC gradients. VistaScan allows scanning the quadrupole synchronously with the TIMS ramp during the mobility scan to optimally cover the ion population in the ion-mobility-mass to charge plane. (References 1 & 2).
VistaScan enables midia-PASEF, exclusively licensed from Johannes Gutenberg University Mainz. Bruker is initiating a limited early-access program for midia-PASEF for immunopeptidomics and post-translational modifications (PTMs) on the ultra-sensitive timsTOF Ultra. These applications benefit from the sensitivity-with-speed of midia-PASEF, as well as the DDA-like precursor traceability that can be extracted from midia-PASEF data.
C. PreOmics ENRICH Kit for affordable, high-throughput ~3,500 PG plasma proteomics
Bruker, together with PreOmics and Biognosys are now offering further improved high-throughput, affordable, medium-depth plasma proteomics kits and CRO services for reliably quantifying ~3,500 protein groups using PreOmics ENRICH-iST microbeads (SP3 technology) from minimal sample amounts and various species without antibodies/aptamers.
D. PepSep™ ULTRA XL and PepSep™ MAX HT columns
Bruker announced the launch of the PepSep™ ULTRA XL and PepSep™ MAX HT columns. The PepSep ULTRA XL was designed for long LC gradients, e.g. for DDA-PASEF spectral library generation, which can improve confidence and coverage in peptide and protein identification during short gradients in DIA-PASEF analysis. The PepSep MAX HT is optimized for short-gradients (<15 min run0times) used for high throughput proteomics.
Dr. Byoung-Kyu Cho, Assistant Professor at Washington University School of Medicine and Proteomics Lead at Mass Spectrometry Technology Access Center (MTAC) commented: “PepSep MAX HT columns have brought a remarkable transformation to our mass spectrometry endeavors. This compact column stands out with superior throughput, enduring robustness, and an interface that is user-friendly, making it easy to operate. To all colleagues in search of top-tier high-throughput data, I endorse the PepSep MAX HT.”
E. TwinScape digital twin functionality in Bruker ProteoScape software
To ensure optimal run conditions for every sample, Bruker introduces TwinScape™, a digital twin for the timsTOF platform, using Bruker ProteoScape software and the Biognosys iRT kit. TwinScape continuously monitors key parameters to ensure that complex assays and large studies are run under optimal conditions, supporting real-time QC with the iRT kit, which contains eleven non-naturally occurring synthetic peptides. The iRT kit peptides have been optimized for stability, sensitivity, rt spacing and peptide CCS.
Dr. Roman Fischer, Associate Professor at University of Oxford, commented: “At the Centre for Translational Proteomics (CTP), we provide services for clients interested in deep proteomes from small sample amounts. Clinical proteomics and spatial proteomics both of require characterization of large sample cohorts at high throughput. Bruker ProteoScape monitors the sample and data quality in real-time, exploiting the outstanding robustness of the timsTOF platforms for high-throughput deep proteomics.”
F. Biological knowledge generation from 4D-Proteomics with Mass Dynamics
Bruker’s collaboration with Prof. Andrew Webb at WEHI, co-founder of Mass Dynamics Pty Ltd, has led to the integration of data from Bruker ProteoScape™ and now Spectronaut® with Mass Dynamics interactive visualization tools for knowledge extraction to allow scientists to answer more biological questions.
G. Novel SpatialOMx workflows enhancing 4D-Proteomics
In collaboration with AmberGen, Bruker further advances the novel MALDI HiPLEX-IHC workflow for spatial proteomics based on antibody-based localization of target proteins with a significantly enhanced probe selection and robust workflows similar to IHC protocols, adapting HiPLEX-IHC to a variety of areas from immunooncology to neuropathology.
Dr. Bernd Bodenmiller, Professor University of Zuerich and ETH Zuerich, and Director of the Department of Quantitative Biomedicine, noted: “Recent research shows that spatial proteomics provides biological context about tissue neighborhoods by providing spatially defined biomarkers. The cellular arrangements and location of proteins in the tissue microenvironment elucidates biological mechanisms in disease or homeostasis, supporting novel precision medicine applications. Using HiPLEX-IHC tissue imaging on our timsTOF fleX enhances our multiomic spatial view of tissue ecosystems.”
H. Novel MetaboScape software for 4D multiomic research
In the new release of MetaboScape®, CCS-enabled 4D-Lipidomics is complemented by integrating semi-quantitative analysis utilizing stable isotopically labeled lipid standards.
Dr. Heiko Hayen, Institute of Inorganic and Analytical Chemistry, University of Münster, Germany, said: “The new CCS-enabled workflow with T-ReX 4D in MetaboScape allows us to accurately normalize our lipid class concentrations with labelled internal standards. By adopting this solution, we observed a noticeable improvement in standard deviations among covered lipids, enhancing reproducibility in our lipidomics research.”
Dr. Viswa Colluru, CEO and Founder of Enveda Biosciences, said: “The open software ecosystem provided by Bruker is at the foundation of our discovery platform. Their CCS-enabled workflows give us an edge in discerning compounds from nature with better resolution. Bruker’s commitment to innovation and customer support makes them a great partner and helps achieve our mission of translating nature into medicine.”
References:
- Distler et al., bioRxiv 2023.01.30.526204, https://doi.org/10.1101/2023.01.30.526204
- Skowronek et al., Molecular & Cellular Proteomics, Feb 2023; 22(2):100489-100489, https://doi.org/10.1016/j.mcpro.2022.100489
- https://www.bruker.com/protected/de/services/software-downloads/mass-spectrometry/acquisition-software.html
About Bruker Corporation (Nasdaq: BRKR)
Bruker is enabling scientists to make breakthrough discoveries and develop new applications that improve the quality of human life. Bruker’s high performance scientific instruments and high value analytical and diagnostic solutions enable scientists to explore life and materials at molecular, cellular, and microscopic levels. In close cooperation with our customers, Bruker is enabling innovation, improved productivity, and customer success in life science molecular and cell biology research, in applied and pharma applications, in microscopy and nanoanalysis, as well as in industrial applications. Bruker offers differentiated, high-value life science and diagnostics systems and solutions in preclinical imaging, clinical phenomics research, proteomics and multiomics, spatial and single-cell biology, functional structural and condensate biology, as well as in clinical microbiology and molecular diagnostics. Please visit www.bruker.com.
View source version on businesswire.com: https://www.businesswire.com/news/home/20230918138030/en/
Media
Petra Scheffer
Bruker Daltonics Marketing Communications
T: +49 (421) 2205-2843
E: [email protected]
Investor Relations
Justin Ward
Sr. Director Investor Relations & Corp Development
T: +1 (978) 663–3660, ext. 1479
E: [email protected]
KEYWORDS: Asia Pacific South Korea
INDUSTRY KEYWORDS: Research Technology Medical Supplies Health Technology Software Biotechnology General Health Pharmaceutical Health Science
MEDIA:
| Logo |
| Photo |
 |
| Fig. 1: TIMSquant for CCS-aware, AI-powered quantification (Graphic: Business Wire) |
| Photo |
 |
| (Graphic: Business Wire) |