
Triple Flag to Acquire Orogen Royalties and Its 1.0% NSR Royalty on the Expanded Silicon Gold Project
All dollar figures in US dollars unless otherwise stated.
TORONTO & VANCOUVER, British Columbia–(BUSINESS WIRE)–
Triple Flag Precious Metals Corp. (TSX: TFPM, NYSE: TFPM) (“Triple Flag”) and Orogen Royalties Inc. (TSX.V: OGN, OTCQX: OGNRF) (“Orogen”) announce that they have entered into a definitive agreement (the “Agreement”) on April 21, 2025, in which Triple Flag will acquire all of the issued and outstanding common shares of Orogen pursuant to a plan of arrangement (the “Transaction”) for total consideration of approximately C$421 million, or C$2.00 per share. The total consideration consists of approximately C$171.5 million in cash, approximately C$171.5 million in Triple Flag shares, and shares of a new company (“Orogen Spinco”) with an implied value of approximately C$78 million. Orogen Spinco will be led by Paddy Nicol, CEO of Orogen, and will hold all of Orogen’s mineral interests except for the 1.0% Expanded Silicon NSR royalty. Upon Orogen Spinco going public, Triple Flag has agreed to separately invest C$10 million to obtain an approximate 11% interest in Orogen Spinco.
This press release features multimedia. View the full release here: https://www.businesswire.com/news/home/20250422066778/en/

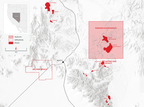
Beatty District Royalty Coverage
Triple Flag and Orogen will host a joint conference call today at 8:30 a.m. ET to discuss the transaction, the details of which are at the end of this release.
“I am extremely pleased to announce this friendly transaction with Orogen, which will result in Triple Flag’s acquisition of a 1.0% NSR royalty on the Expanded Silicon project. This is a rare opportunity to acquire a gold asset located in a premier jurisdiction and operated by a top-tier operator, AngloGold Ashanti plc. Nevada is a prolific gold mining region and host to many of the world’s most successful producers. Given the rapid pace of resource growth demonstrated at Expanded Silicon, we believe that the long-term growth potential of this asset in an emerging new gold camp is unparalleled. This royalty is a great illustration of the value creation inherent in the royalty model, as we will benefit from future exploration expenditures and success, as well as the future capital expenditures to develop the project, at no further cost to Triple Flag,” said Sheldon Vanderkooy, CEO of Triple Flag. “We are also excited for our new strategic partnership with the Orogen Spinco team, led by Paddy Nicol. Orogen Spinco provides exposure to a portfolio of exploration-stage royalties as well as compelling upside potential from a management team that has an established track record of discovering district-scale assets from grassroots exploration, including Expanded Silicon.”
Paddy Nicol, President and CEO of Orogen said, “Today’s announcement validates the tremendous growth in value that our royalty on the Expanded Silicon project has provided our shareholders, and crystallizing that value is an important part of Orogen’s business strategy. We strongly believe in the long-term growth potential for Expanded Silicon, and Triple Flag is exactly the right home for such a royalty asset.
“Orogen will be spun-out as a new company and will continue its pursuit of organic royalty creation and royalty acquisition with the stability of the cash-flowing Ermitaño royalty, our treasury, our portfolio of exciting exploration-stage royalties, and various discovery opportunities through its exploration partnerships and alliances. We are also pleased to count Triple Flag as a new strategic investor and alliance partner and look forward to creating opportunities in western USA analogous to Expanded Silicon. Importantly, Orogen’s team that organically created the Ermitaño and Expanded Silicon royalties stays intact, as does our intent to develop new royalty opportunities with strong leverage to value creation.”
Terms of the Agreement
Pursuant to the Transaction, Orogen shareholders may elect to receive either C$1.63 in cash or 0.05355 of a Triple Flag share per each Orogen share held, and will also receive 0.25 shares in the newly created Orogen Spinco, representing approximately C$0.37 per each Orogen share. This represents a total consideration of C$2.00 per Orogen common share on a fully diluted basis, calculated using the closing price of Triple Flag shares on April 17, 2025 of C$30.44. The total consideration paid by Triple Flag (excluding the value of Orogen Spinco) is approximately C$343 million.
The shareholder election will be subject to pro-ration such that the cash and share portions of the consideration will represent 50% and 50% of the total consideration (excluding the value of Orogen Spinco), respectively. Orogen shareholders who do not elect to receive either Triple Flag shares or cash will be deemed to elect a default consideration of 0.05355 of a Triple Flag share per Orogen share, in addition to 0.25 shares in Orogen Spinco per Orogen share.
The total value of the transaction is approximately C$421 million, or C$2.00 per common share of Orogen on a fully diluted basis. Following the completion of the transaction, Orogen shareholders will own approximately 3% of Triple Flag. Triple Flag will finance the cash consideration from its existing undrawn $700 million credit facility.
The total consideration, including the implied value of Orogen Spinco, implies a premium of 38% based on the closing share prices of Triple Flag and Orogen on the Toronto Stock Exchange (“TSX”) and TSX Venture Exchange (“TSX.V”), respectively, on April 17, 2025, and a premium of 32% based on the 20-day volume-weighted average share prices of Triple Flag and Orogen on the TSX and TSX.V as of April 17, 2025, respectively.
Strategic Rationale for Triple Flag
The Transaction will provide Triple Flag with exposure to one of the world’s most promising gold development assets and adds meaningful gold equivalent ounces to Triple Flag’s growth outlook beyond 2029. Key highlights include:
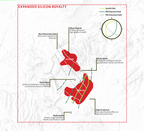
- A life-of-mine royalty on a Tier 1 gold asset in Nevada. The 1.0% NSR royalty on the Expanded Silicon gold project, which includes the cornerstone Merlin and Silicon deposits, is located in the Beatty District of Nevada and covers a 74 km2 area of interest. There are no caps, step-downs, or buydown provisions on the royalty. Nevada hosts some of the most prolific gold operations in the world, including Carlin and Cortez, operated by Nevada Gold Mines LLC, a joint venture between Barrick Gold Corporation and Newmont Corporation.
- North America’s largest new gold discovery with a track record of rapid growth. As stated by AngloGold Ashanti plc (“AngloGold”), the Expanded Silicon project represents the largest new gold discovery by resource in the United States in over a decade.
The asset has grown rapidly since AngloGold began drilling the target in 2018. A maiden inferred resource at Silicon of 120 million tonnes grading 0.87 g/t Au containing 3.4 million ounces was declared as of December 31, 2021i. Subsequent resource updates included the nearby Merlin deposit. As of December 31, 2024, inferred resources at Merlin totaled 355 million tonnes grading 1.06 g/t Au containing 12.1 million ouncesii. Resources at Silicon totaled 121 million tonnes grading 0.87 g/t Au containing 3.4 million ounces in the indicated category, and 36 million tonnes grading 0.70 g/t Au containing 0.8 million ounces in the inferred categoryii.
To date, 430 kilometers have been drilled at Expanded Silicon, including 132 kilometers at Merlin in 2024.
- A Tier 1 operator focused on delivering a pre-feasibility study in the near term. TheExpanded Silicon project is 100% owned by AngloGold and is currently envisioned as a large oxide deposit with potential processing from heap leaching and milling. The processing of a high-grade core at Merlin is expected to drive stronger production earlier in the mine life.
AngloGold is a senior gold producer that is well capitalized and has the operating expertise to explore, permit, develop and operate Expanded Silicon. The Beatty District complex of assets represents a core tenet of AngloGold’s future, with the operator recently moving its corporate headquarters from Johannesburg to Denver and establishing a new primary share listing on the NYSE.
AngloGold’s stated key priorities for 2025 at Expanded Silicon are to advance a pre-feasibility study, continue infill drilling at Merlin to potentially upgrade resources to reserves, and execute strategic land and water acquisitions.
- Significant exploration potential. Drill rigs remain active on the property, focusing on infill and resource upgrade drilling. Notably, ongoing reporting by AngloGold has highlighted several significant intercepts in widely spaced drill holes located within the western part of the current conceptual pit that forms part of the Merlin mineralization, but such drilling may not yet be included in currently published resource estimates due to insufficient drill density. Additionally, there remains significant potential to extend mineralization in areas with limited to no drilling, including extensions to the north, west and east of Merlin, as well as to the northwest of Silicon. Notably, AngloGold has indicated the potential discovery of a downfaulted offset to Merlin to the southeast of the currently defined mineralized footprint.
With significant value already derived from the current and potential oxide footprint, longer-term potential exists from underground exploration. Mineralization remains open in multiple directions, with significant potential for deep, high-grade feeder structures within the sulphide zones.
- Enhances Triple Flag’s exposure to AngloGold’s complex of assets in the Beatty District. Triple Flag also owns a 2.0% NSR royalty on Mother Lode, which represents the third largest endowment of the currently defined total resources in the Beatty District owned by AngloGold, after Expanded Silicon and North Bullfrog. As of December 31, 2024, measured and indicated resources at Mother Lode totaled 60 million tonnes at a grade of 0.80 g/t Au containing 1.6 million ounces, and inferred resources totaled 10 million tonnes at a grade of 0.55 g/t Au containing 0.2 million ouncesii.
The drill testing of extensions to the south of Merlin would assess the potential for mineralization between Merlin and Mother Lode.
Separately, Triple Flag has a 0.5% to 5.5% NSR royalty on the Bullfrog project located six kilometers west of Beatty and operated by Augusta Gold Corp. As of December 31, 2021, measured and indicated resources at Bullfrog totaled 71 million tonnes at a grade of 0.53 g/t Au containing 1.2 million ouncesiii. Inferred resources totaled 17 million tonnes at a grade of 0.48 g/t Au containing 0.3 million ouncesiii. Bullfrog is currently envisioned as a heap leach operation and a pre-feasibility study is being advanced.
Benefits to Orogen Shareholders
This Transaction allows Orogen shareholders to crystallize the significant value that has been created through the Expanded Silicon 1.0% NSR royalty. This Transaction also allows Orogen shareholders to retain exposure through Orogen Spinco to the full suite of assets outside Expanded Silicon and the same Orogen team, led by Paddy Nicol, that created this value.
- Significant premium of approximately 38%, which includes the implied value of Orogen Spinco, and based on the closing share prices of Triple Flag and Orogen as of April 17, 2025, on the TSX and TSX.V, respectively, and a premium of 32% based on the 20-day volume-weighted average share prices of Triple Flag and Orogen on the TSX and TSX.V as of April 17, 2025, respectively
- Ongoing equity participation in the larger and more liquid Triple Flag shares, with significantly enhanced capital markets exposure
- Exposure to Triple Flag’s high-quality portfolio of diversified producing, development, and exploration assets, including Expanded Silicon
- Ongoing return of capital through participation in Triple Flag’s quarterly dividend
- Enhanced exposure through Orogen Spinco to the upside potential from the remainder of Orogen’s portfolio of operating, development and exploration royalty assets, as well as continued exposure to the top-tier Orogen management team
- Orogen Spinco fully endorsed by Triple Flag through its separate C$10 million investment, providing Orogen Spinco with significantly enhanced financial capacity
- New exploration alliance to be formed between Triple Flag and Orogen Spinco in respect of areas in the western United States
Orogen Spinco
Orogen Spinco will be led by Paddy Nicol and the current Orogen management and exploration team. Pursuant to the plan of arrangement, all of the assets and liabilities of Orogen other than the 1.0% NSR royalty on Expanded Silicon will be transferred to Orogen Spinco, the shares of which will be distributed to Orogen shareholders as part of the consideration. The following will be transferred to Orogen Spinco:
-
Ermitaño 2.0% NSR royalty;
- Ermitaño is a producing gold and silver mine located in Mexico, operated by First Majestic Silver Corp. Royalty revenue generated by Ermitaño was C$7.9 million in 2024
- C$15 to C$20 million in working capital and no debt on a pro-forma basis after transaction costs and the Triple Flag placement
- A portfolio of 27 exploration-stage royalties, including the La Rica porphyry target in Colombia, the MPD South copper project in British Columbia, and the Spring Peak gold project in Nevada
- A pipeline of organic royalties created through exploration partnerships, including seven current option deals, four exploration alliances, and five available properties
Western United States Exploration Alliance
Orogen and Triple Flag have also agreed to negotiate the formation of a generative exploration alliance in the western United States, whereby Triple Flag will provide funding to Orogen Spinco for generating gold and silver targets considered geologically similar to the top-tier Expanded Silicon project. The initial $435,000 budget will focus on identifying prospective exploration opportunities for incoming exploration partners.
The commercial objective of the generative exploration alliance is to sell 100% of the interest in identified exploration opportunities in exchange for cash, equity and a retained royalty.
Transaction Conditions and Timing
Under the terms of the Agreement, the Transaction will be carried out by way of a court-approved plan of arrangement under the Business Corporations Act (British Columbia) and will require the approval at a special meeting of at least (i) 66 2/3% of the votes cast by the shareholders of Orogen and (ii) a majority of the votes cast by shareholders of Orogen excluding the votes attributable to certain members of management.
Altius Minerals Corporation, Adrian Day Asset Management, and Euro Pacific Asset Management, together with all of the officers and directors of Orogen, collectively control approximately 39.5% of the common shares of Orogen on a fully diluted basis and have entered into voting support agreements pursuant to which they have agreed to vote their shares in favor of the Transaction, subject to certain conditions.
Completion of the Transaction is also subject to regulatory and court approvals and other customary closing conditions, including the listing of Orogen Spinco on the TSX.V. The Agreement includes customary provisions, including non-solicitation by Orogen of alternative transactions, a right of Triple Flag to match superior proposals and an approximately $12.5 million termination fee, payable under certain circumstances.
Complete details of the Transaction will be included in a management information circular to be delivered to Orogen shareholders in the coming weeks. Subject to receiving requisite court approval, the special meeting of shareholders of Orogen is expected to be held in late June 2025, and the Transaction is expected to close in the third quarter of 2025. In connection with and subject to closing the Transaction, it is expected that the common shares of Orogen will be delisted from the TSX.V and that Orogen will cease to be a reporting issuer under Canadian and U.S. securities laws.
Board of Directors’ Recommendations
The Board of Directors of Triple Flag and the Board of Directors of Orogen have unanimously approved the Transaction and recommend that shareholders vote in favor of the Transaction.
National Bank Financial has provided a fairness opinion dated April 21, 2025, to the Board of Directors stating that, as of the date of such opinion, and based upon and subject to the assumptions, limitations and qualifications stated in such opinion, the consideration to be received by the shareholders of Orogen under the Transaction is fair, from a financial point of view, to such Orogen shareholders.
Scotiabank has provided a fairness opinion dated April 21, 2025, to the Board of Directors of Triple Flag stating that, as of the date of such opinion, and based upon and subject to the assumptions, limitations and qualifications stated in such opinion, the consideration to be paid by Triple Flag to the shareholders of Orogen under the Transaction is fair, from a financial point of view, to Triple Flag.
Advisors and Counsel
Scotiabank is acting as financial advisor to Triple Flag and Torys LLP is acting as legal counsel to Triple Flag. Scotiabank provided a fairness opinion to the Triple Flag Board of Directors.
National Bank Financial is acting as financial advisor to Orogen and Osler, Hoskin & Harcourt LLP is acting as legal counsel to Orogen. National Bank Financial provided a fairness opinion to the Orogen Board of Directors.
Conference Call and Webcast
Triple Flag and Orogen will hold a joint conference call and webcast on April 22, 2025 at 8:30 a.m. ET (5:30 a.m. PT) to discuss the Transaction. The live webcast can be accessed by visiting the Events and Presentations page on the Company’s website at: www.tripleflagpm.com. An archived version of the webcast will be available on the website for one year following the webcast.
|
Live Webcast: |
||
|
Dial-In Details:
|
Toll-Free (U.S. & Canada): +1 (888) 596-4144 International: +1 (646) 968-2525 Conference ID: 9159639, followed by # key |
|
|
Replay (Until May 6):
|
Toll-Free (U.S. & Canada): +1 (800) 770-2030 International: +1 (647) 362-9199 Conference ID: 9159639, followed by # key |
About Triple Flag
Triple Flag is a precious metals streaming and royalty company. We offer investors exposure to gold and silver from a total of 236 assets, consisting of 17 streams and 219 royalties, primarily from the Americas and Australia. These streams and royalties are tied to mining assets at various stages of the mine life cycle, including 30 producing mines and 206 development and exploration stage projects. Triple Flag is listed on the Toronto Stock Exchange and New York Stock Exchange under the ticker “TFPM”.
About Orogen
Orogen Royalties is focused on organic royalty creation and royalty acquisitions on precious and base metal discoveries in western North America. The Company’s royalty portfolio includes the Ermitaño gold and silver mine in Sonora, Mexico (2.0% NSR royalty) operated by First Majestic Silver Corp. and the Expanded Silicon project (1.0% NSR royalty) in Nevada, USA, being advanced by AngloGold Ashanti plc. The Company is well financed with several projects actively being developed by joint venture partners.
Qualified Person
James Lill, Director, Mining for Triple Flag Precious Metals and a “qualified person” under NI 43-101 has reviewed and approved the written scientific and technical disclosures contained in this press release.
Cautionary Statement to U.S. Investors
Information contained or referenced in this press release or in the documents referenced herein concerning the properties, technical information and operations of Triple Flag has been prepared in accordance with requirements and standards under Canadian securities laws, which differ from the requirements of the U.S. Securities and Exchange Commission (“SEC”) under subpart 1300 of Regulation S-K (“S-K 1300”). Because the Company is eligible for the Multijurisdictional Disclosure System adopted by the SEC and Canadian Securities Administrators, Triple Flag is not required to present disclosure regarding its mineral properties in compliance with S-K 1300. Accordingly, certain information contained in this press release may not be comparable to similar information made public by U.S. companies subject to reporting and disclosure requirements of the SEC.
Technical and Third-Party Information
Triple Flag and/or Orogen do not own, develop or mine the underlying properties on which they hold stream or royalty interests. As a royalty or stream holder, Triple Flag and/or Orogen have limited, if any, access to properties included in its asset portfolio. As a result, Triple Flag and/or Orogen are dependent on the owners or operators of the properties and their qualified persons to provide information to Triple Flag and/or Orogen and on publicly available information to prepare disclosure pertaining to properties and operations on the properties on which Triple Flag and/or Orogen hold stream, royalty or other similar interests. Triple Flag and/or Orogen generally have limited or no ability to independently verify such information. Although Triple Flag and/or Orogen do not believe that such information is inaccurate or incomplete in any material respect, there can be no assurance that such third-party information is complete or accurate.
Cautionary Note Regarding Forward-Looking Information and Statements
This news release contains “forward-looking information” within the meaning of applicable Canadian securities laws and “forward-looking statements” within the meaning of the United States Private Securities Litigation Reform Act of 1995, respectively (collectively referred to herein as “forward-looking information”). Forward-looking information may be identified by the use of forward-looking terminology such as “plans”, “targets”, “expects”, “is expected”, “budget”, “scheduled”, “estimates”, “outlook”, “forecasts”, “projection”, “prospects”, “strategy”, “intends”, “anticipates”, “believes”, or variations of such words and phrases or terminology which states that certain actions, events or results “may”, “could”, “would”, “might”, “will”, “will be taken”, “occur” or “be achieved”. Forward-looking information in this news release includes: expected timing and completion of the proposed Transaction; the expected delisting of the common shares of Orogen from certain stock exchanges and the subsequent application for listing of shares of Orogen Spinco on proposed exchanges; the reporting issuer status of Orogen; the upside potential of Orogen Spinco; the entering into and expected benefits of the exploration alliance in western USA; achieving and satisfying the shareholder and other approvals necessary to complete the proposed Transaction; the strengths, characteristics and expected benefits of the proposed Transaction; and the companies’ assessments of, and expectations for, future periods (including, but not limited to, the long-term production outlook for GEOs). In addition, any statements that refer to expectations, intentions, projections or other characterizations of future events or circumstances, including information in this news release regarding the Transaction and the anticipated benefits therefrom, contain forward-looking information. Statements containing forward-looking information are not historical facts but instead represent the companies’ expectations, estimates and projections regarding possible future events or circumstances.
The forward-looking information included in this news release is based on the companies’ opinions, estimates and assumptions in light of their experience and perception of historical trends, current conditions and expected future developments, their assumptions regarding the Transaction (including, but not limited to, their ability to close the Transaction on the terms contemplated, and to derive the anticipated benefits therefrom), as well as other factors that they currently believe are appropriate and reasonable in the circumstances. The forward-looking information contained in this news release is also based upon a number of assumptions, including the companies’ ability to obtain the required shareholder, court and regulatory approvals in a timely manner, if at all; their ability to satisfy the terms and conditions precedent of the Agreement in order to consummate the proposed Transaction; the ongoing operation of the properties in which they hold a stream or royalty interest by the owners or operators of such properties in a manner consistent with past practice; the accuracy of public statements and disclosures made by the owners or operators of such underlying properties; and the accuracy of publicly disclosed expectations for the development of underlying properties that are not yet in production. These assumptions include, but are not limited to, the following: assumptions in respect of current and future market conditions and the execution of the companies’ business strategies, that operations, or ramp-up where applicable, at properties in which they hold a royalty, stream or other interest, continue without further interruption through the period, and the absence of any other factors that could cause actions, events or results to differ from those anticipated, estimated, intended or implied. Despite a careful process to prepare and review the forward-looking information, there can be no assurance that the underlying opinions, estimates and assumptions will prove to be correct. Forward-looking information is also subject to known and unknown risks, uncertainties and other factors that may cause the actual results, level of activity, performance or achievements to be materially different from those expressed or implied by such forward-looking information. Such risks, uncertainties and other factors include, but are not limited to, failure to receive the required shareholder, court, regulatory and other approvals necessary to effect the proposed Transaction; the potential for a third party to make a superior proposal to the proposed Transaction; and those set forth under the caption “Risk Factors” in the companies’ respective annual information forms (if applicable) and in their most recent management’s discussion and analysis. For clarity, mineral resources that are not mineral reserves do not have demonstrated economic viability and inferred resources are considered too geologically speculative for the application of economic considerations. Although the companies have attempted to identify important risk factors that could cause actual results or future events to differ materially from those contained in forward-looking information, there may be other risk factors not presently known to them or that they presently believe are not material that could also cause actual results or future events to differ materially from those expressed in such forward-looking information. There can be no assurance that such information will prove to be accurate, as actual results and future events could differ materially from those anticipated in such information. Accordingly, readers should not place undue reliance on forward-looking information, which speaks only as of the date made. The forward-looking information contained in this news release represents the companies’ expectations as of the date of this news release and is subject to change after such date. Triple Flag and Orogen each disclaim any intention or obligation or undertaking to update or revise any forward-looking information whether as a result of new information, future events or otherwise, except as required by applicable securities laws. All of the forward-looking information contained in this news release is expressly qualified by the foregoing cautionary statements. U.S. Securities Law Disclaimer: None of the securities anticipated to be issued pursuant to the Transaction have been or will be registered under the United States Securities Act of 1933, as amended (the “U.S. Securities Act”), or any state securities laws, and any securities issued in the Transaction are anticipated to be issued in reliance upon available exemptions from registration requirements pursuant to Section 3(a)(10) of the U.S. Securities Act and applicable exemptions under state securities laws. This news release does not constitute an offer to sell or the solicitation of an offer to buy any securities.
i Refer to AngloGold Ashanti’s Mineral Resource and Ore Reserve Report as of December 31, 2021, available on www.anglogoldashanti.com/
ii Refer to AngloGold Ashanti’s Mineral Resource and Mineral Reserve Report as of December 31, 2024, available on www.anglogoldashanti.com/
iii Refer to the technical report entitled “NI 43-101 Technical Report Mineral Resource Estimate Bullfrog Gold Project, Nye County, Nevada” with an effective date of December 31, 2021, prepared for Augusta Gold Corp. (“Augusta”) on March 16, 2022 and available on Augusta’s SEDAR+ profile.
View source version on businesswire.com: https://www.businesswire.com/news/home/20250422066778/en/
Triple Flag Contact
Investor Relations:
David Lee
Vice President, Investor Relations
Tel: +1 (416) 304-9770
Email: [email protected]
Media:
Gordon Poole, Camarco
Tel: +44 (0) 7730 567 938
Email: [email protected]
Orogen Contact
Paddy Nicol
President & CEO
Tel: +1 (604) 248-8648
Marco LoCascio
Vice President, Corporate Development
Tel: +1 (604) 248-8648
KEYWORDS: North America Canada
INDUSTRY KEYWORDS: Natural Resources Other Natural Resources Mining/Minerals
MEDIA:
| Photo |
 |
| Beatty District Royalty Coverage |
| Photo |
 |
| Expanded Silicon Royalty |
| Logo |
 |


