Systematic Drilling Outlines New High-grade Mineralized Vein Sets Over 630m Strike, Connecting Keats and 515 Zones
VANCOUVER, British Columbia–(BUSINESS WIRE)–New Found Gold Corp. (“New Found” or the “Company”) (TSX-V: NFG, NYSE-A: NFGC) is pleased to announce the results from 17 diamond drill holes that were completed as part of an ongoing systematic drill program exploring a highly prospective segment of the Appleton Fault Zone (“AFZ”) immediately north of the Keats Zone. New Found’s 100% owned Queensway project comprises an approximately 1500km2 area, accessible via the Trans-Canada Highway approximately 15km west of Gander, Newfoundland and Labrador.
This press release features multimedia. View the full release here: https://www.businesswire.com/news/home/20220802005505/en/

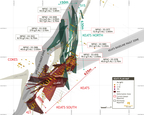
Figure 1. Keats 3D plan view map (150m-clipping) (Photo: Business Wire)
Keats North Highlights:
Keats North comprises multiple newly discovered high-grade gold veins in a corridor covering approximately 630m of strike northwards from the northern end of Keats Main to the recently discovered 515 zone, reported on April 13, 2022 (see Figure 1). Highlight results from recent drilling in this corridor include:
|
Hole No. |
From (m) |
To (m) |
Interval (m)1 |
Au (g/t) |
Prospect |
Vein/Zone |
||||||
|
NFGC-22-559 |
131.95 |
134.00 |
2.05 |
13.2 |
Keats North |
Enigma |
||||||
|
Including |
133.00 |
134.00 |
1.00 |
24.7 |
Keats North |
|||||||
|
And |
148.00 |
150.70 |
2.70 |
10.7 |
Keats North |
|||||||
|
Including |
148.00 |
149.70 |
1.70 |
14.9 |
Keats North |
|||||||
|
NFGC-22-577 |
34.20 |
36.80 |
2.60 |
12.9 |
Keats North |
Apogee |
||||||
|
Including |
36.15 |
36.80 |
0.65 |
48.9 |
Keats North |
|||||||
|
NFGC-22-578 |
22.55 |
25.30 |
2.75 |
45.9 |
Keats North |
Umbra/Keats Main |
||||||
|
Including |
22.55 |
23.35 |
0.80 |
142.0 |
||||||||
|
NFGC-22-580 |
52.00 |
54.20 |
2.20 |
24.1 |
Keats North |
Enigma |
||||||
|
Including |
53.20 |
53.70 |
0.50 |
105.5 |
||||||||
|
NFGC-22-586 |
48.00 |
50.00 |
2.00 |
40.6 |
Keats North |
Enigma |
||||||
|
Including |
49.45 |
50.00 |
0.55 |
147.5 |
Keats North |
|||||||
|
NFGC-22-610 |
46.55 |
48.60 |
2.05 |
19.3 |
Keats North |
Umbra/ Keats Main |
||||||
|
Including |
47.75 |
48.30 |
0.55 |
65.6 |
Table 1: Keats North Drilling Highlights
1Note that the host structures are interpreted to be steeply dipping and true widths are unknown at this time. Infill veining in secondary structures with multiple orientations crosscutting the primary host structures are commonly observed in drill core which could result in additional uncertainty in true width. Composite intervals reported carry a minimum weighted average of 1 g/t Au diluted over a minimum core length of 2m with a maximum of 2m consecutive dilution. Included high-grade intercepts are reported as any consecutive interval with grades greater than 10 g/t Au. Grades have not been capped in the averaging and intervals are reported as drill thickness.
- These new results are defining an extensive network of mineralized veins including Umbra, Penumbra, Apogee, Enigma, and Perigee/515 over a roughly 630m long x 150m wide area linking Keats Main and the 515 discovery area (Figure 1). These veins start at the surface, are generally steeply dipping, and to date have been drill tested to a maximum vertical depth of 125m.
-
Noteworthy intervals in these veins include:
- 45.9 g/t Au over 2.75m in NFGC-22-578 (Umbra);
- 19.3 g/t Au over 2.05m in NFGC-22-610 (Umbra);
- 40.6 g/t Au over 2.00m in NFGC-22-586 (Enigma);
- 24.1 g/t Au over 2.20m in NFGC-22-580 (Enigma);
- and 13.2 g/t Au over 2.05m and 10.7 g/t Au over 2.70m in NFGC-22-559 (Enigma).
- Due to a thin cover of glacial till there is very limited surface exposure of bedrock along the AFZ corridor including between Keats Main and Golden Joint, and until recently there had been essentially no drill testing of this gap. In early 2022 the Company implemented a program of systematic grid drilling between Keats and Golden Joint leading to the 515 discovery (43.9 g/t Au over 3.85m in NFGC-22-515 (reported April 13, 2022) and two near surface intervals of 8.70 g/t Au over 6.75m in NFGC-22-533 and 275 g/t Au over 2.15m in NFGC-22-538 (reported May 4, 2022).
- The results reported in this release are the initial assays following up on these discovery holes, with further results including several high priority holes anticipated in the next several weeks.
VP of Exploration Melissa Render stated: “Our drilling is demonstrating that the corridor surrounding the Appleton Fault Zone is prolifically mineralized via a series of interconnected structures and vein sets that form a webbing shown to occur within a few hundred-meter-wide damage zone on either side of the of the primary, crustal-scale fault. These veins are not constrained by orientation or stratigraphy, which greatly increases the amount of strike length and the variety of lithological environments to explore. In specific areas, blow outs of gold mineralization occur where veins and structures cross paths, as illustrated at Keats Main, Lotto, and Golden Joint. The complexity and extent of the system provides an opportunity for discovery in a very large volume of prospective host stratigraphy.
We have now ramped up to 14 drills to continue to accelerate our exploration and rate of discovery. Today’s news outlines an area roughly equal to the strike length of Keats, connecting two zones together that were previously separate. Drilling in this area remains sparse and shallow, with several priority assays pending.”
Discussion
Mineralization at the Queensway Project is hosted by a fold-thrust sequence of northeast-striking, steeply dipping turbiditic sedimentary rocks deposited and deformed during the closure of the Iapetus Ocean and subsequent continent-continent collision. During this prolonged period of continued shortening, at least two regional-deformation zones developed and include the Appleton (“AFZ”) and JBP fault zones. The AFZ is interpreted to be a significant, deep-seated thrust fault that strikes southwest across the full 100km+ length of the property and is likely the main conduit for the gold mineralizing fluids, much like the Cadillac-Larder Lake Fault Zone in the Abitibi.
As a result of progressive deformation, the brittle host stratigraphy developed an extensive network of gold-bearing fault zones enveloping the AFZ, the extents of which are not yet known. Higher-grades and widths of gold mineralization occur in areas where there was greater mineralizing fluid flow such as at structural intersections, at dilational openings within fault structures, and along lithological contacts where breakage occurs due to rheological differences in the compressional strength of contrasting sedimentary rock units. A significant amount of the high-grade gold mineralization is interpreted to be epizonal in nature, having been emplaced when tectonic movements resulted in the explosive tapping of deep gold-rich magmatic fluids that rapidly precipitated gold as they migrated towards surface.
The Keats-Baseline Fault Zone (‘KBFZ’) is an extensive brittle fault zone that lies to the east of the AFZ and runs slightly oblique to it and has an east-northeast strike (N55°E) and dips to the southeast at approximately 60°. This fault forms an extensive damage zone that is discordant to the stratigraphy, and it controls the development of a complex network of brittle, high-grade gold vein arrays that are epizonal in character. Gold mineralization is characterized by the presence of quartz-carbonate veins with vuggy, stylolitic and/or brecciated textures which often contain trace amounts of arsenopyrite, chalcopyrite, boulangerite or pyrite, and which are associated with a NH4 muscovite alteration. A variety of fault and vein orientations have been encountered within and surrounding the KBFZ, forming a complex network of high-grade vein splays bifurcating from the KBFZ and the AFZ. Cross-cutting the Keats Main zone and forming important constituents of the KBFZ network are several conjugate brittle faults that are gold-rich and that create lenses of high-grade gold mineralization. Examples of such structures are the Umbra, Penumbra, Solstice, Eclipse, and 421 zones (Figure 1). The Umbra and Penumbra structures strike approximately north-south and have been intersected over a strike length of approximately 630m and are interpreted to play an important role for concentrating high-grade gold in the Keats North region.
Drillhole Details
|
Hole No. |
From (m) |
To (m) |
Interval (m)1 |
Au (g/t) |
Prospect |
Vein/Zone |
||||||
|
NFGC-22-535A |
No Significant Values |
Keats North |
Keats North |
|||||||||
|
NFGC-22-544 |
53.00 |
56.00 |
3.00 |
1.6 |
Keats North
|
Umbra/Keats Main |
||||||
|
And |
76.00 |
78.00 |
2.00 |
1.4 |
||||||||
|
And |
82.15 |
84.65 |
2.50 |
5.2 |
||||||||
|
Including |
83.45 |
84.10 |
0.65 |
12.5 |
||||||||
|
NFGC-22-545 |
199.70 |
202.35 |
2.65 |
4.7 |
Keats North
|
Penumbra |
||||||
|
Including |
200.00 |
201.00 |
1.00 |
11.1 |
||||||||
|
NFGC-22-559 |
131.95 |
134.00 |
2.05 |
13.2 |
Keats North |
Enigma |
||||||
|
Including |
133.00 |
134.00 |
1.00 |
24.7 |
||||||||
|
And |
148.00 |
150.70 |
2.70 |
10.7 |
||||||||
|
Including |
148.00 |
149.70 |
1.70 |
14.9 |
||||||||
|
And |
158.70 |
161.80 |
3.10 |
1.5 |
||||||||
|
NFGC-22-567 |
95.35 |
97.55 |
2.20 |
1.0 |
Keats North |
Apogee |
||||||
|
NFGC-22-571 |
No Significant Values |
Keats North |
Umbra/Keats Main |
|||||||||
|
NFGC-22-573 |
18.70 |
21.00 |
2.30 |
3.0 |
Keats North |
Enigma |
||||||
|
NFGC-22-575 |
21.00 |
23.45 |
2.45 |
1.1 |
Keats North |
Enigma |
||||||
|
And |
49.00 |
51.10 |
2.10 |
3.1 |
||||||||
|
Including |
50.00 |
50.45 |
0.45 |
14.3 |
||||||||
|
NFGC-22-577 |
34.20 |
36.80 |
2.60 |
12.9 |
Keats North |
Apogee |
||||||
|
Including |
36.15 |
36.80 |
0.65 |
48.9 |
||||||||
|
NFGC-22-578 |
22.55 |
25.30 |
2.75 |
45.9 |
Keats North |
Umbra/Keats Main |
||||||
|
Including |
22.55 |
23.35 |
0.80 |
142.0 |
||||||||
|
And |
28.75 |
30.75 |
2.00 |
1.4 |
||||||||
|
And |
32.00 |
34.00 |
2.00 |
1.1 |
||||||||
|
NFGC-22-580 |
11.00 |
13.00 |
2.00 |
2.8 |
Keats North |
Enigma |
||||||
|
And |
31.00 |
33.60 |
2.60 |
1.4 |
||||||||
|
And |
40.50 |
43.30 |
2.80 |
2.7 |
||||||||
|
And |
52.00 |
54.20 |
2.20 |
24.1 |
||||||||
|
Including |
53.20 |
53.70 |
0.50 |
105.5 |
||||||||
|
NFGC-22-585 |
No Significant Values |
Keats North |
Enigma |
|||||||||
|
NFGC-22-586 |
48.00 |
50.00 |
2.00 |
40.6 |
Keats North |
Enigma |
||||||
|
Including |
49.45 |
50.00 |
0.55 |
147.5 |
||||||||
|
NFGC-22-602 |
182.30 |
184.50 |
2.20 |
5.3 |
Keats North |
Perigee/515 |
||||||
|
Including |
183.00 |
184.00 |
1.00 |
10.6 |
||||||||
|
NFGC-22-603 |
No Significant Values |
Keats North |
Keats North |
|||||||||
|
NFGC-22-610 |
46.55 |
48.60 |
2.05 |
19.3 |
Keats North |
Umbra/Keats Main |
||||||
|
Including |
47.75 |
48.30 |
0.55 |
65.6 |
||||||||
|
And |
93.70 |
95.70 |
2.00 |
1.1 |
||||||||
|
NFGC-22-625 |
33.00 |
35.00 |
2.00 |
4.2 |
Keats North |
Enigma |
||||||
|
Including |
33.80 |
34.50 |
0.70 |
11.9 |
||||||||
Table 2: Summary of composite results reported in this press release for Keats North
1Note that the host structures are interpreted to be steeply dipping and true widths are unknown at this time. Infill veining in secondary structures with multiple orientations crosscutting the primary host structures are commonly observed in drill core which could result in additional uncertainty in true width. Composite intervals reported carry a minimum weighted average of 1 g/t Au diluted over a minimum core length of 2m with a maximum of 2m consecutive dilution. Included high-grade intercepts are reported as any consecutive interval with grades greater than 10 g/t Au. Grades have not been capped in the averaging and intervals are reported as drill thickness.
|
Hole No. |
Azimuth (°) |
Dip (°) |
Length (m) |
UTM E |
UTM N |
|||||
|
NFGC-22-535A |
297 |
-43 |
260 |
658343 |
5428026 |
|||||
|
NFGC-22-544 |
300 |
-45 |
188 |
658270 |
5427549 |
|||||
|
NFGC-22-545 |
299 |
-47 |
581 |
658236 |
5427684 |
|||||
|
NFGC-22-559 |
300 |
-45 |
333 |
658233 |
5427628 |
|||||
|
NFGC-22-567 |
300 |
-45 |
368 |
658288 |
5427886 |
|||||
|
NFGC-22-571 |
300 |
-45 |
126 |
658253 |
5427573 |
|||||
|
NFGC-22-573 |
300 |
-45 |
111 |
658184 |
5427714 |
|||||
|
NFGC-22-575 |
300 |
-45 |
85 |
658178 |
5427704 |
|||||
|
NFGC-22-577 |
300 |
-45 |
260 |
658244 |
5427852 |
|||||
|
NFGC-22-578 |
300 |
-45 |
117 |
658258 |
5427556 |
|||||
|
NFGC-22-580 |
300 |
-45 |
110 |
658188 |
5427698 |
|||||
|
NFGC-22-585 |
300 |
-45 |
162 |
658198 |
5427692 |
|||||
|
NFGC-22-586 |
300 |
-45 |
332 |
658162 |
5427669 |
|||||
|
NFGC-22-602 |
300 |
-45 |
335 |
658339 |
5427970 |
|||||
|
NFGC-22-603 |
120 |
-45 |
305 |
658207 |
5428162 |
|||||
|
NFGC-22-610 |
300 |
-45 |
312 |
658283 |
5427571 |
|||||
|
NFGC-22-625 |
300 |
-45 |
353 |
658176 |
5427689 |
Table 3: Details of drill holes reported in this press release
Queensway 400,000m Drill Program Update
Approximately 56% of the planned 400,000m program at Queensway has been drilled to date with ~28,000m of the core still pending assay results. Fourteen (14) core rigs are currently operating meeting New Found’s targeted drill count for Q2.
Sampling, Sub-sampling, Laboratory and Discussion
True widths of the intercepts reported in this press release have yet to be determined and further exploration is required. Infill veining in secondary structures with multiple orientations crosscutting the primary host structures are commonly observed in drill core which could result in additional variability in true width. Assays are uncut, and composite intervals are calculated using a minimum weighted average of 1 g/t Au diluted over a minimum core length of 2m with a maximum of 2m consecutive dilution. Included high-grade intercepts are reported as any consecutive interval with grades greater than 10 g/t Au.
All drilling recovers HQ core. Drill core is split in half using a diamond saw or a hydraulic splitter for rare intersections with incompetent core.
A professional geologist examines the drill core and marks out the intervals to be sampled and the cutting line. Sample lengths are mostly 1.0 meter and adjusted to respect lithological and/or mineralogical contacts and isolate narrow (<1.0m) veins or other structures that may yield higher grades. Once all sample intervals have been chosen, photos of the wet and dry core are taken for future reference.
Technicians saw the core along the defined cut-line. One-half of the core is kept as a witness sample and the other half is submitted for crushing, pulverizing, and assaying. Individual sample bags are sealed and placed into shipping pails and/or nylon shipping bags, sealed and marked with the contents.
Drill core samples are shipped to ALS Canada Ltd. (ALS) for sample preparation in Sudbury, Ontario, Thunder Bay, Ontario, or Moncton, New Brunswick; an ISO-17025 accredited laboratory. ALS operates under a commercial contract with New Found.
The entire sample is crushed to approximately 70% passing 2 mm. A 3,000-g split is pulverized. “Routine” samples do not have visible gold (VG) identified and are not within a mineralized zone. Routine samples are assayed for gold by 30-g fire assay with an inductively-couple plasma spectrometry (ICP) finish. If the initial 30-g fire assay gold result is over 1 g/t, the remainder of the 3,000-g split is screened at 106 microns for screened metallics assay. For the screened metallics assay, the entire coarse fraction (sized greater than 106 microns) is fire assayed and two splits of the fine fraction (sized less than 106 microns) are fire assayed. The three assays are combined on a weight-averaged basis.
Samples that have VG identified or fall within a mineralized interval are automatically submitted for screened metallic assay for gold.
All sample pulps are also analyzed for a multi-element ICP package (ALS method code ICP61).
Drill program design, Quality Assurance/Quality Control and interpretation of results are performed by qualified persons employing a rigorous Quality Assurance/Quality Control program consistent with industry best practices. Standards and blanks account for a minimum of 10% of the samples in addition to the laboratory’s internal quality assurance programs.
Quality Control data are evaluated on receipt from the laboratories for failures. Appropriate action is taken if assay results for standards and blanks fall outside allowed tolerances. All results stated have passed New Found’s quality control protocols.
New Found’s quality control program also includes submission of the second half of the core for approximately 5% of the drilled intervals. In addition, approximately 1% of sample pulps for mineralized samples are submitted for re-analysis to a second ISO-accredited laboratory for check assays.
The Company does not recognize any factors of drilling, sampling or recovery that could materially affect the accuracy or reliability of the assay data disclosed.
The assay data disclosed in this news release have been verified by the Company’s Qualified Person against the original assay certificates.
The Company notes that it has not completed any economic evaluations of its Queensway Project and that the Queensway Project does not have any resources or reserves.
Qualified Person
The technical content disclosed in this press release was reviewed and approved by Greg Matheson, P. Geo., Chief Operating Officer, and a Qualified Person as defined under National Instrument 43-101. Mr. Matheson consents to the publication of this press release dated August 2, 2022, by New Found. Mr. Matheson certifies that this press release fairly and accurately represents the information for which he is responsible.
About New Found Gold Corp.
New Found holds a 100% interest in the Queensway Project, located 15km west of Gander, Newfoundland, and just 18km from Gander International Airport. The project is intersected by the Trans-Canada Highway and has logging roads crosscutting the project, high voltage electric power lines running through the project area, and easy access to a highly skilled workforce. The Company is currently undertaking a 400,000m drill program at Queensway, now approximately 56% complete. The Company is well funded for this program with cash and marketable securities of approximately $77 million as of August 2022.
Please see the Company’s website at www.newfoundgold.ca and the Company’s SEDAR profile at www.sedar.com.
Acknowledgements
New Found acknowledges the financial support of the Junior Exploration Assistance Program, Department of Natural Resources, Government of Newfoundland and Labrador.
Contact
To contact the Company, please visit the Company’s website, www.newfoundgold.ca and make your request through our investor inquiry form. Our management has a pledge to be in touch with any investor inquiries within 24 hours.
Neither the TSX Venture Exchange nor its Regulation Services Provider (as that term is defined in the policies of the TSX Venture Exchange) accepts responsibility for the adequacy or accuracy of this release.
Forward-Looking Statement Cautions
This press release contains certain “forward-looking statements” within the meaning of Canadian securities legislation, relating to assay results, exploration and drilling on the Company’s Queensway gold project in Newfoundland, interpretation of the assay results and the results of the drilling program, the discovery of zones of high-grade gold mineralization, the timing of future drilling results and funding of the drilling program. Although the Company believes that such statements are reasonable, it can give no assurance that such expectations will prove to be correct. Forward-looking statements are statements that are not historical facts; they are generally, but not always, identified by the words “expects,” “plans,” “anticipates,” “believes,” “intends,” “estimates,” “projects,” “aims,” “suggests,” “potential,” “goal,” “objective,” “prospective,” “possibly,” and similar expressions, or that events or conditions “will,” “would,” “may,” “can,” “could” or “should” occur, or are those statements, which, by their nature, refer to future events. The Company cautions that forward-looking statements are based on the beliefs, estimates and opinions of the Company’s management on the date the statements are made, and they involve a number of risks and uncertainties. Consequently, there can be no assurances that such statements will prove to be accurate and actual results and future events could differ materially from those anticipated in such statements. Except to the extent required by applicable securities laws and the policies of the TSX Venture Exchange, the Company undertakes no obligation to update these forward-looking statements if management’s beliefs, estimates or opinions, or other factors, should change. Factors that could cause future results to differ materially from those anticipated in these forward-looking statements include risks associated with possible accidents and other risks associated with mineral exploration operations, the risk that the Company will encounter unanticipated geological factors, risks associated with the interpretation of assay results and the drilling program, the possibility that the Company may not be able to secure permitting and other governmental clearances necessary to carry out the Company’s exploration plans, the risk that the Company will not be able to raise sufficient funds to carry out its business plans, and the risk of political uncertainties and regulatory or legal changes that might interfere with the Company’s business and prospects. The reader is urged to refer to the Company’s Annual Information Form and Management’s discussion and Analysis, publicly available through the Canadian Securities Administrators’ System for Electronic Document Analysis and Retrieval (SEDAR) at www.sedar.com for a more complete discussion of such risk factors and their potential effects.
View source version on businesswire.com: https://www.businesswire.com/news/home/20220802005505/en/
New Found Gold Corp.
Per: “Collin Kettell”
Collin Kettell, Chief Executive Officer
Email: [email protected]
Phone: +1 (845) 535-1486
KEYWORDS: North America Canada
INDUSTRY KEYWORDS: Mining/Minerals Natural Resources
MEDIA:
| Logo |
| Photo |
 |
| Figure 1. Keats 3D plan view map (150m-clipping) (Photo: Business Wire) |
| Photo |
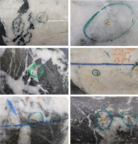 |
| Figure 2: Photos of mineralization from: Top Left: at ~53.3m in NFGC-22-580, Middle Left: at ~149.6m in NFGC-22-559, Bottom Left: at ~47m in NFGC-22-610, Top Right: at ~ 133.5m in NFGC-22-559, Middle Right: at ~ 20.9m in NFGC-22-573 and Bottom Right: at ~ 49.9m in NFGC-22-586. ^Note that these photos are not intended to be representative of gold mineralization in holes NFGC-22-580, NFGC-22-559, NFGC-22-610, NFGC-22-573 and NFGC-22-586. (Photo: Business Wire) |